Published on July 23, 2020
By: James Coyne, Senior Vice President; Carrie O’Neill, Assistant Vice President; and Peter Hoegler, Senior Analyst
Investor-owned utility (“IOU”) valuations have increased over the past decade. As measured in the context of merger and acquisition (“M&A”) transactions, price-to-earnings ratios increased from 2010 through 2019 with an average of 25x and a median of 21x.[1] Acquisition premiums over the same time period averaged 28.1% with a median of 25.6%.[2] Excluding the economic downturn years of 2007–2009, there is a clear upward trend, and some industry observers and analysts have questioned whether utilities are overvalued.[3]

When we examine utility valuations from an alternative perspective, we see that market-to-book ratios since 2010 for the same utilities at the time transactions were announced have increased less than P/E or EV/EBITDA ratios. The market-to-book averaged 2.4x since 2010, with a median of 1.9x. Measured over time, the median market-to-book of deals from 2010–2014 was 1.7x, and the median from 2015–2019 was 2.1x, which is an approximate 24% increase during the decade. As a comparison, EV/EBITDA ratios increased 29%, and P/E ratios increased 30% from 2010–2014 to 2015–2019.
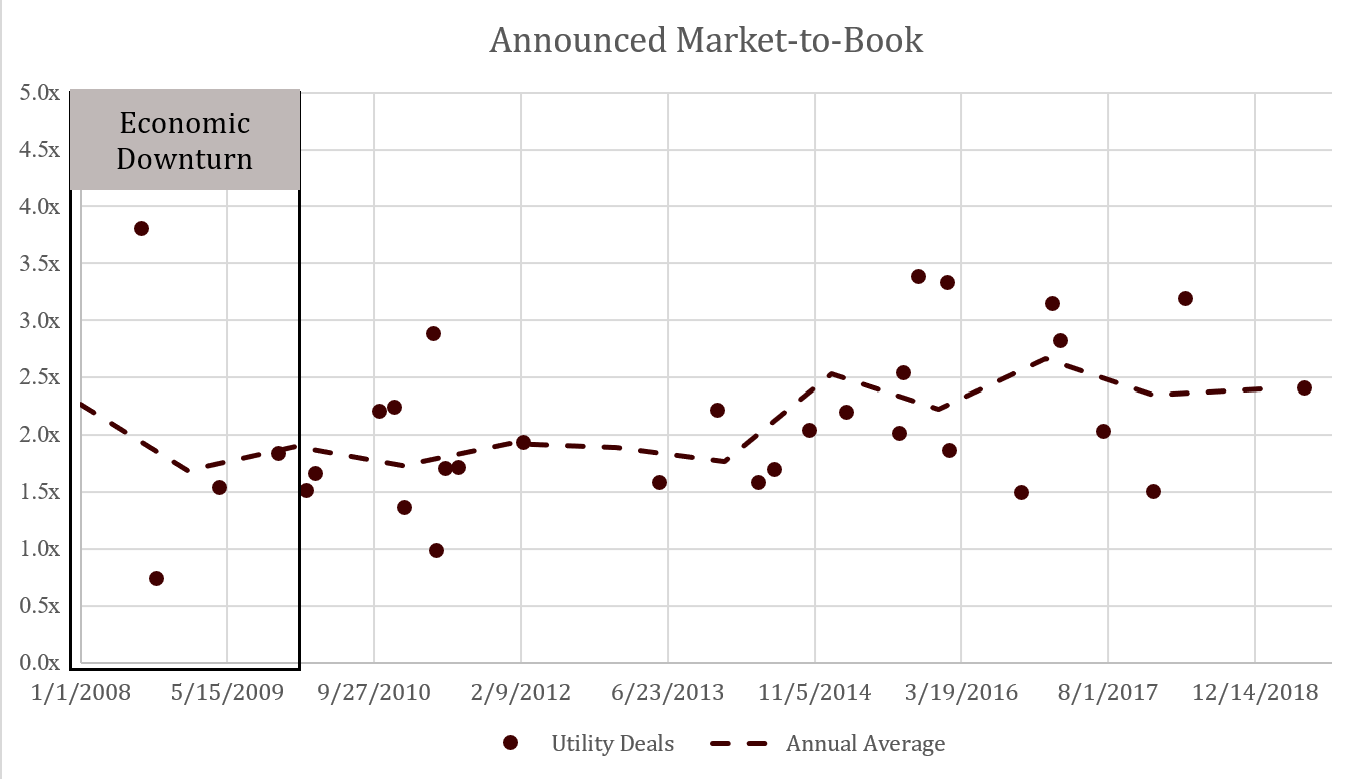
Why have market-to-book ratios increased less, and why is book value important?
We know that utility investors are generally not focused on market-to-book when assessing the right value for utility transactions; rather, they are focused on the value of future earnings and cash flows. The market-to-book ratio tells another story, but they are related, and capital investment is the link.
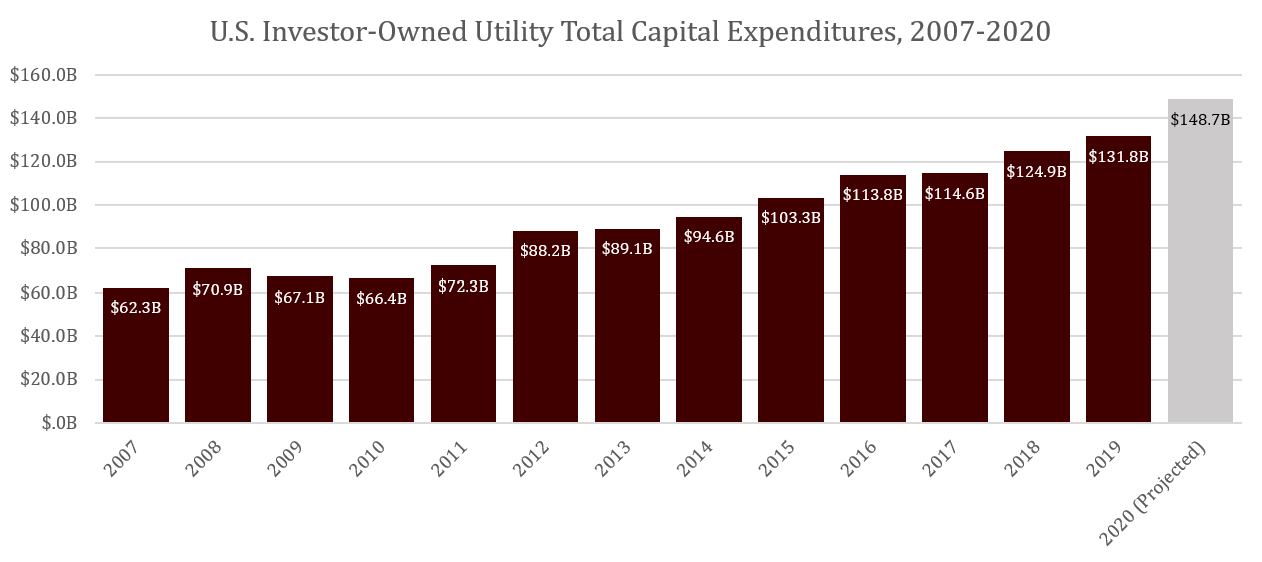
U.S. electric and gas IOUs increased their capital investment spending by 112% from 2007 through 2019, with a compound annual growth rate of 6.5%. As illustrated in the following chart, current year capital investment could reach $148.7 billion, an increase of $17 billion from the previous year, unless utilities curtail their investment programs based on the pandemic and uncertain economic outlook. The connection between capital spending, market-to-book ratios, and utility valuations is this—capital investment growth has led to greater earnings (utility earnings for most utilities are tied to growth in rate base), which in turn has supported the higher market valuations. Those higher valuations are justified by investments showing up in a growing rate base (measured in net book value) and earnings potential.
The data indicates that although valuations seem relatively high, IOUs are continuing to invest in infrastructure, and current price-to-earnings ratios do not tell the full story. Investments in utility infrastructure create earnings over periods up to 50 years, and book value is a measure of that earnings potential. Although all three ratios measured have been increasing, in market-to-book terms, utility valuations have increased less, on average, suggesting they are not as over-valued as some may think.
The authors’ interpretation of the data is two-fold. First, each utility is different and must be valued based on its individual circumstances. Second, the premiums paid for utilities may be justified by the prospects for future growth, driven by investments in a smarter and more resilient grid, replacing aging infrastructure, acquiring sustainable energy resources, and deploying technologies designed to improve system performance and customer choices. This investment cycle may slow in the wake of the pandemic, and markets may be more volatile (as they were following the economic downturn of 2007–2009), but these drivers of utility investment are long term in nature, suggesting continued strength in utility valuations for the foreseeable future.
All views expressed by the authors are solely the authors’ current views and do not reflect the views of Concentric Energy Advisors, Inc., its affiliates, subsidiaries, or related companies. The authors’ views are based upon information the authors consider reliable. However, neither Concentric Energy Advisors, Inc., nor its affiliates, subsidiaries, and related companies warrant the information’s completeness or accuracy, and it should not be relied upon as such.
Disclaimer Notice: Reproduction of any information, data or material, including ratings (“Content”) in any form is prohibited except with the prior written permission of the relevant party. Such party, its affiliates and suppliers (“Content Providers”) do not guarantee the accuracy, adequacy, completeness, timeliness or availability of any Content and are not responsible for any errors or omissions (negligent or otherwise), regardless of the cause, or for the results obtained from the use of such Content. In no event shall Content Providers be liable for any damages, costs, expenses, legal fees, or losses (including lost income or lost profit and opportunity costs) in connection with any use of the Content. A reference to a particular investment or security, a rating or any observation concerning an investment that is part of the Content is not a recommendation to buy, sell or hold such investment or security, does not address the suitability of an investment or security and should not be relied on as investment advice. Credit ratings are statements of opinions and are not statements of fact.
[1] Announced P/E ratio refers to deal value per share as of the announcement date divided by the consensus EPS for the fiscal year as of the announcement date.
[2] Measured by the acquisition share price in relation to the 100-day average stock price prior to announcement.
[3] During the economic downturn of 2007–2009 the announced P/E ratios were volatile and therefore left out of the analysis.