Published on August 6, 2020
By: Bickey Rimal, Assistant Vice President
The most recent electricity consumption data from the U.S. Energy Information Administration (“EIA”) reveals that the COVID-19 pandemic is significantly impacting electric utilities throughout the country. A continuing decline in sales during the peak summer period coupled with misaligned rate design and structures does not bode well for the utilities. The most adversely impacted utilities are those that:
- Possess rate structures that recover a disproportionate share of fixed costs through volumetric rates;
- Lack rate adjustment/revenue stabilization mechanisms (e.g., revenue decoupling, formula rate plans, multi-year rate plans, etc.); and/or
- Have a higher proportion of sales from the commercial and industrial customers relative to the residential customers.
U.S. Electricity Sales Since COVID-19
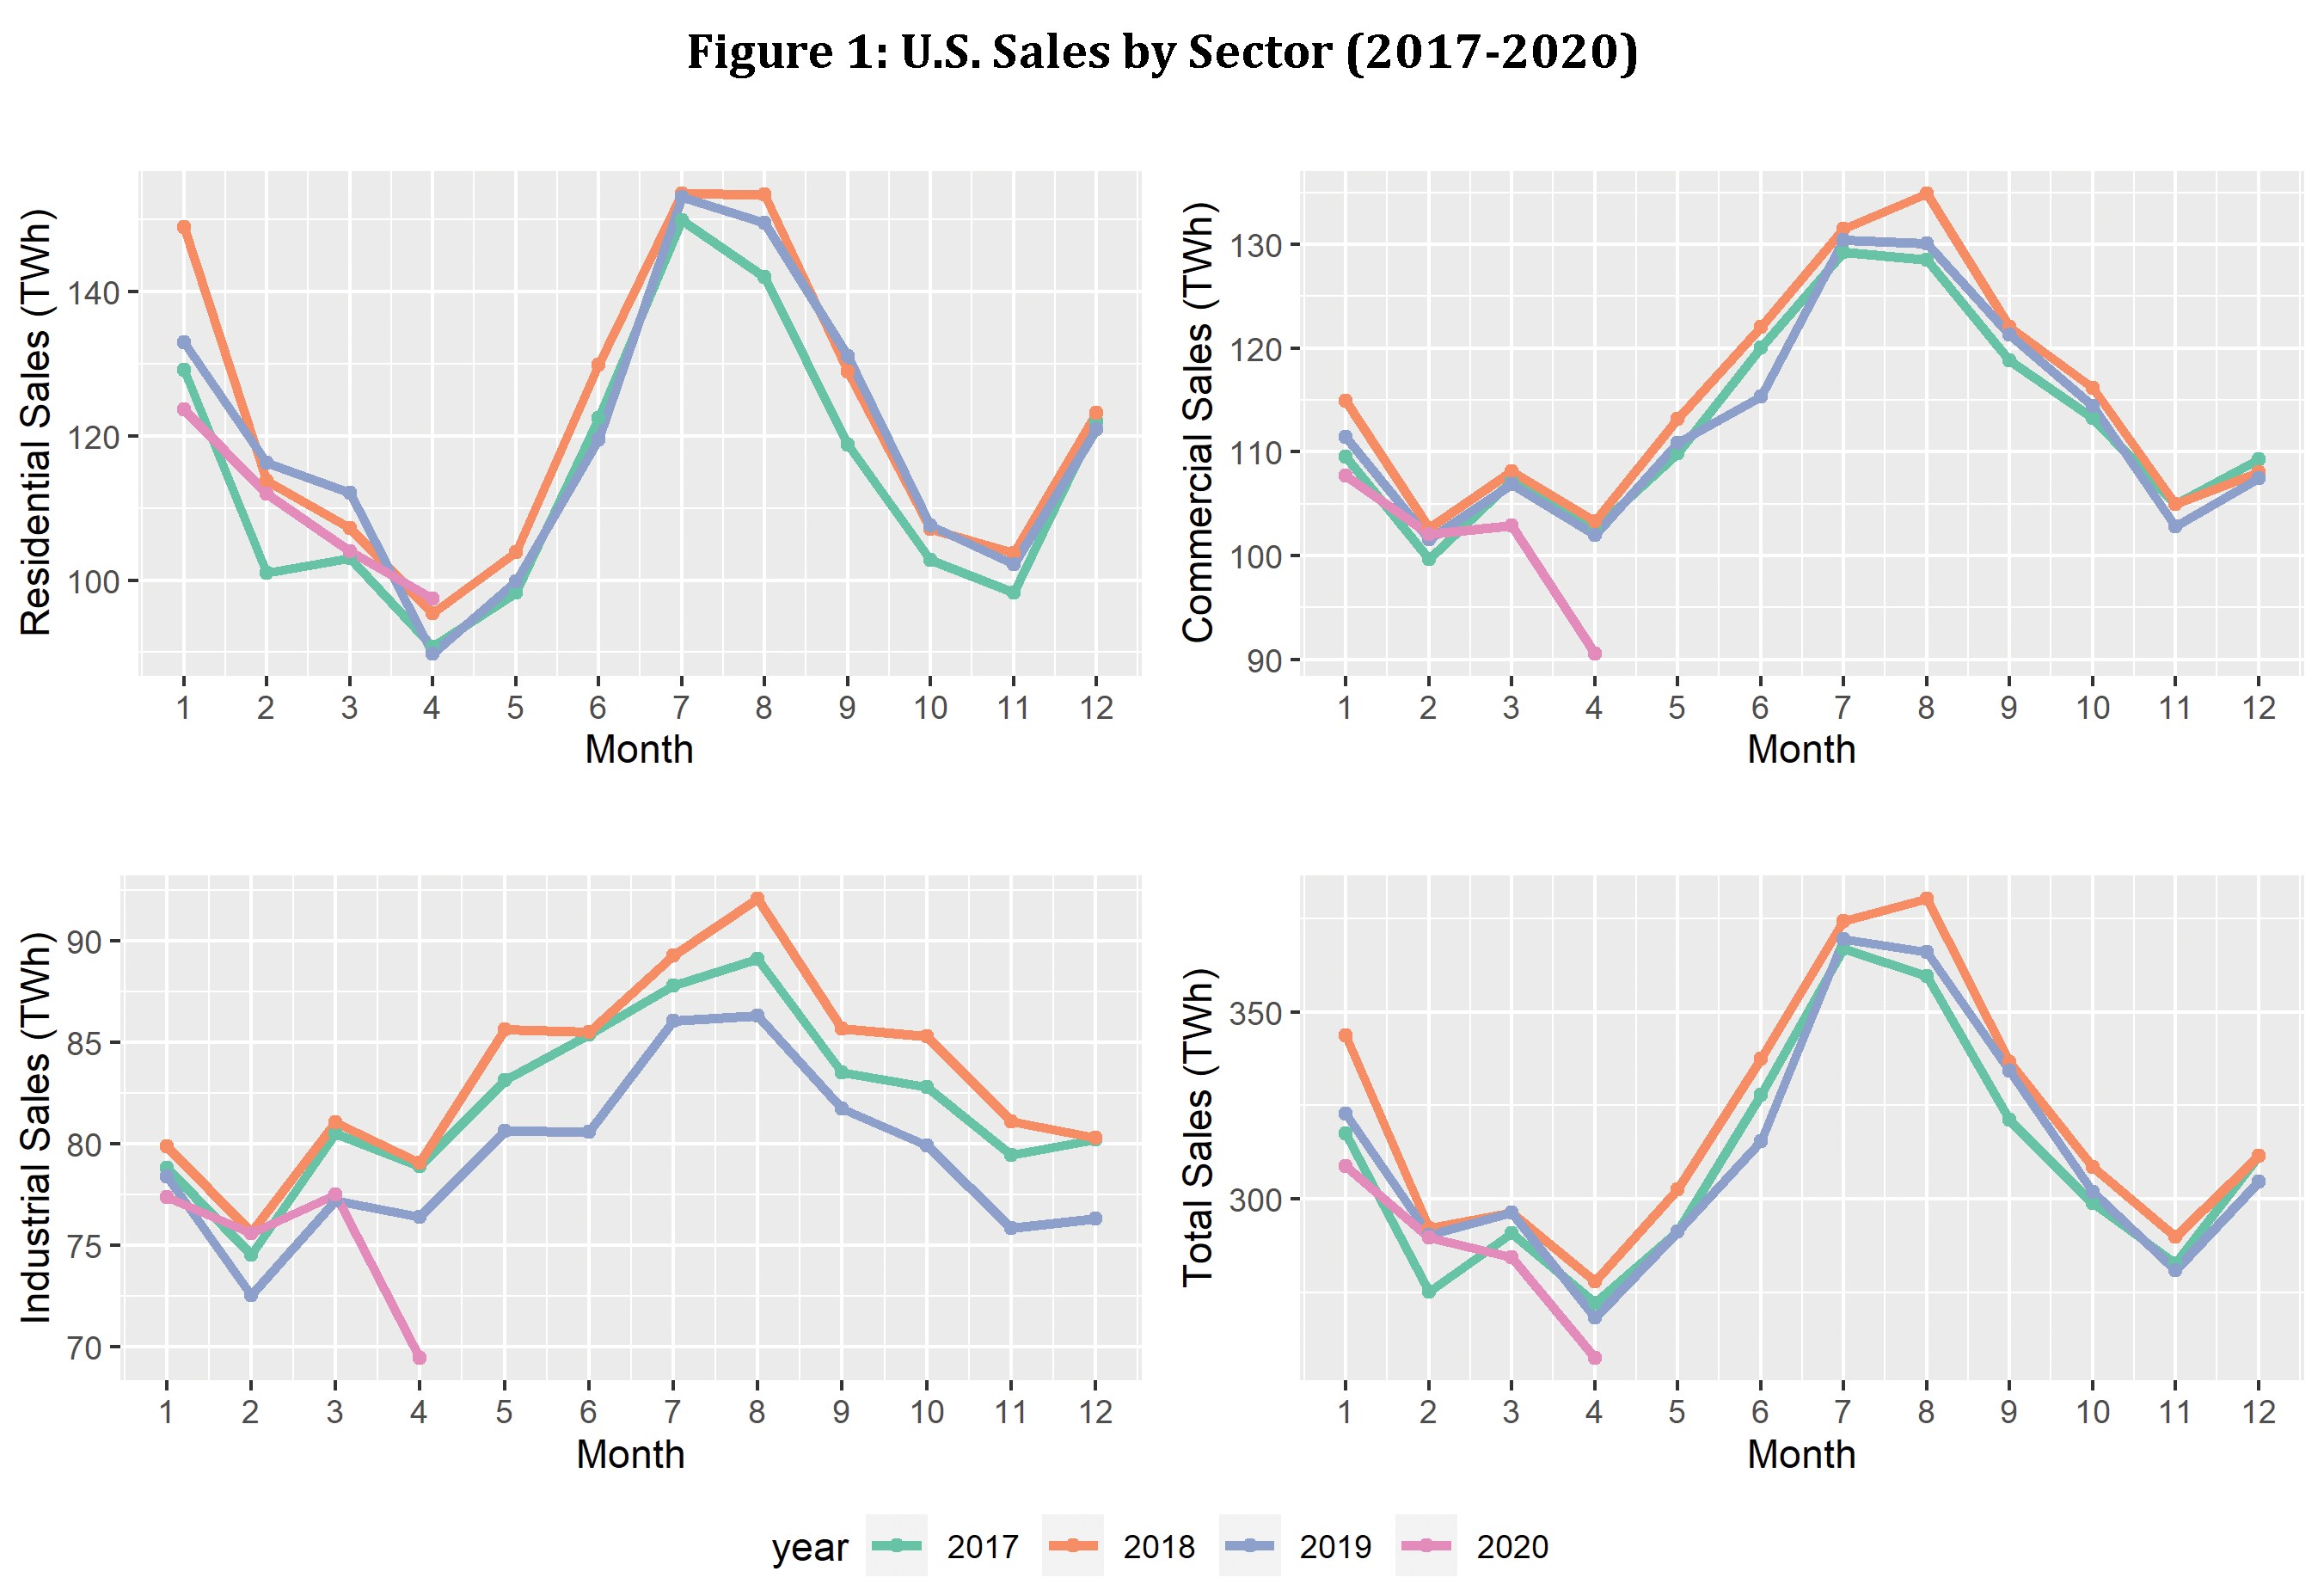
Based on the most recent monthly data published by EIA, total electricity sales in April of 2020 was the lowest level experienced since 2003, despite the fact that residential sales were their highest levels since 2001. [1] Commercial and industrial sectors experienced their lowest April sales since 2003. The following graph shows the monthly sales by sector over the last few years.
State-Specific Sales Since COVID-19
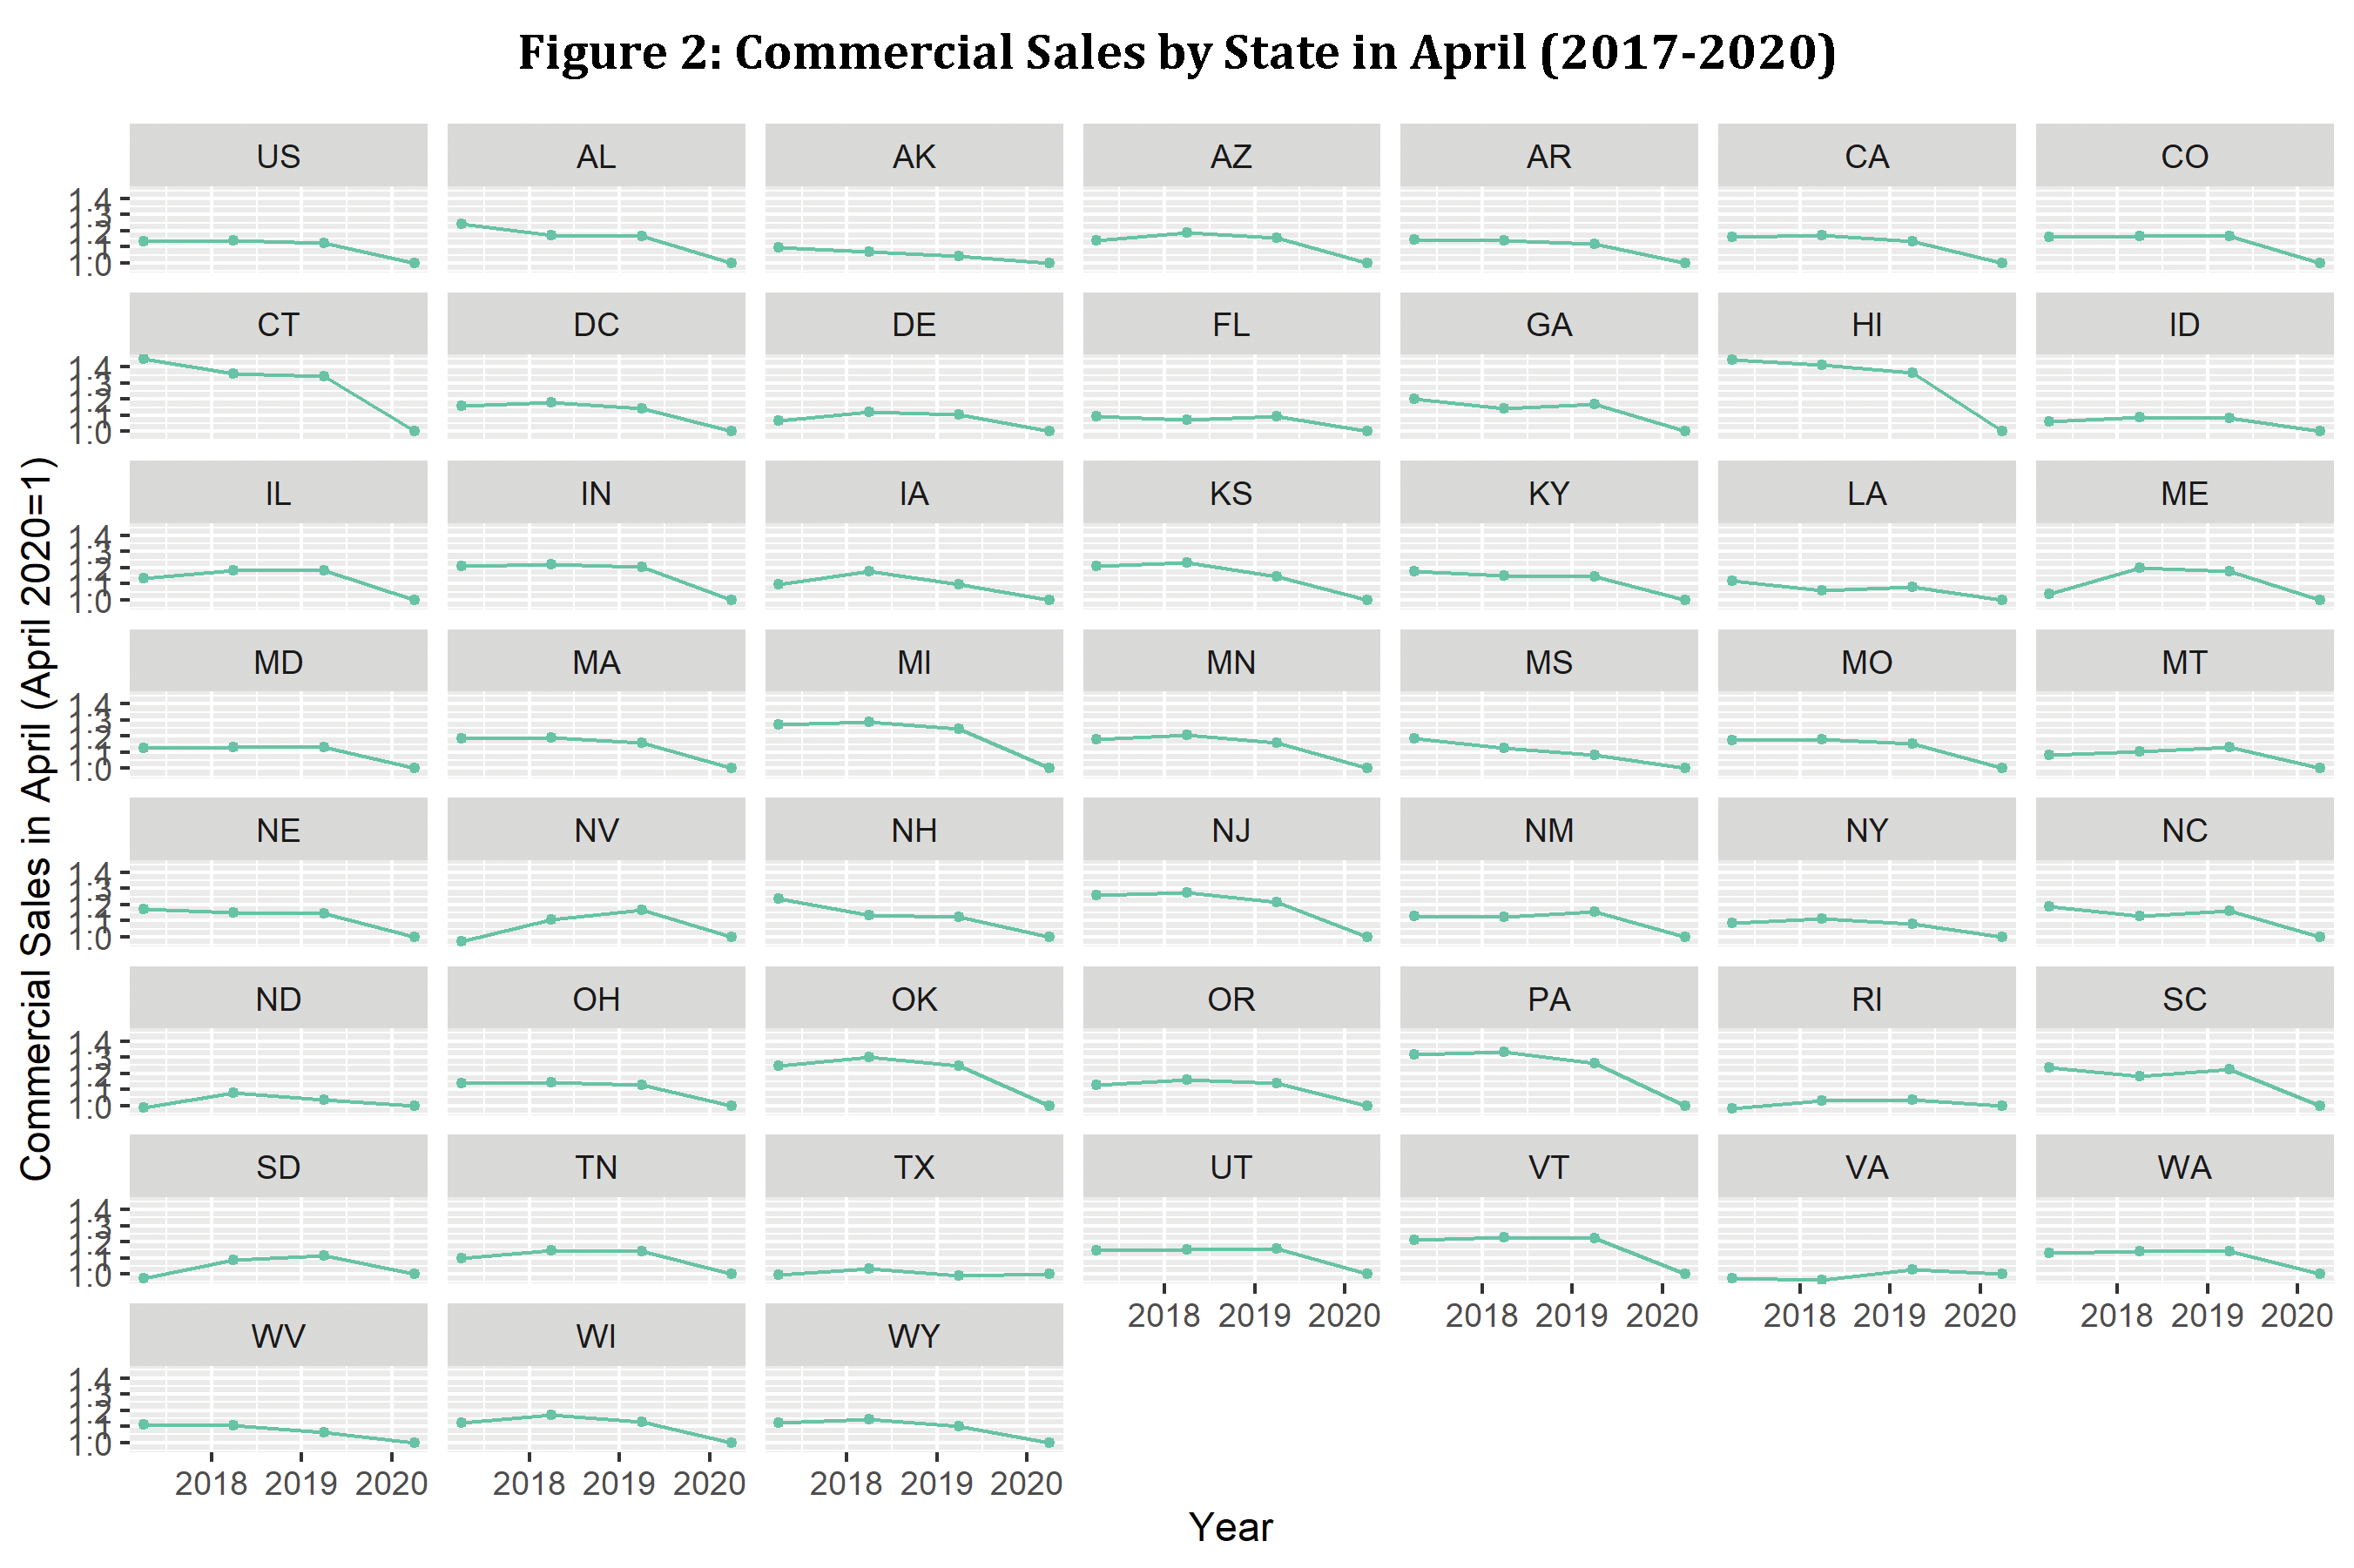
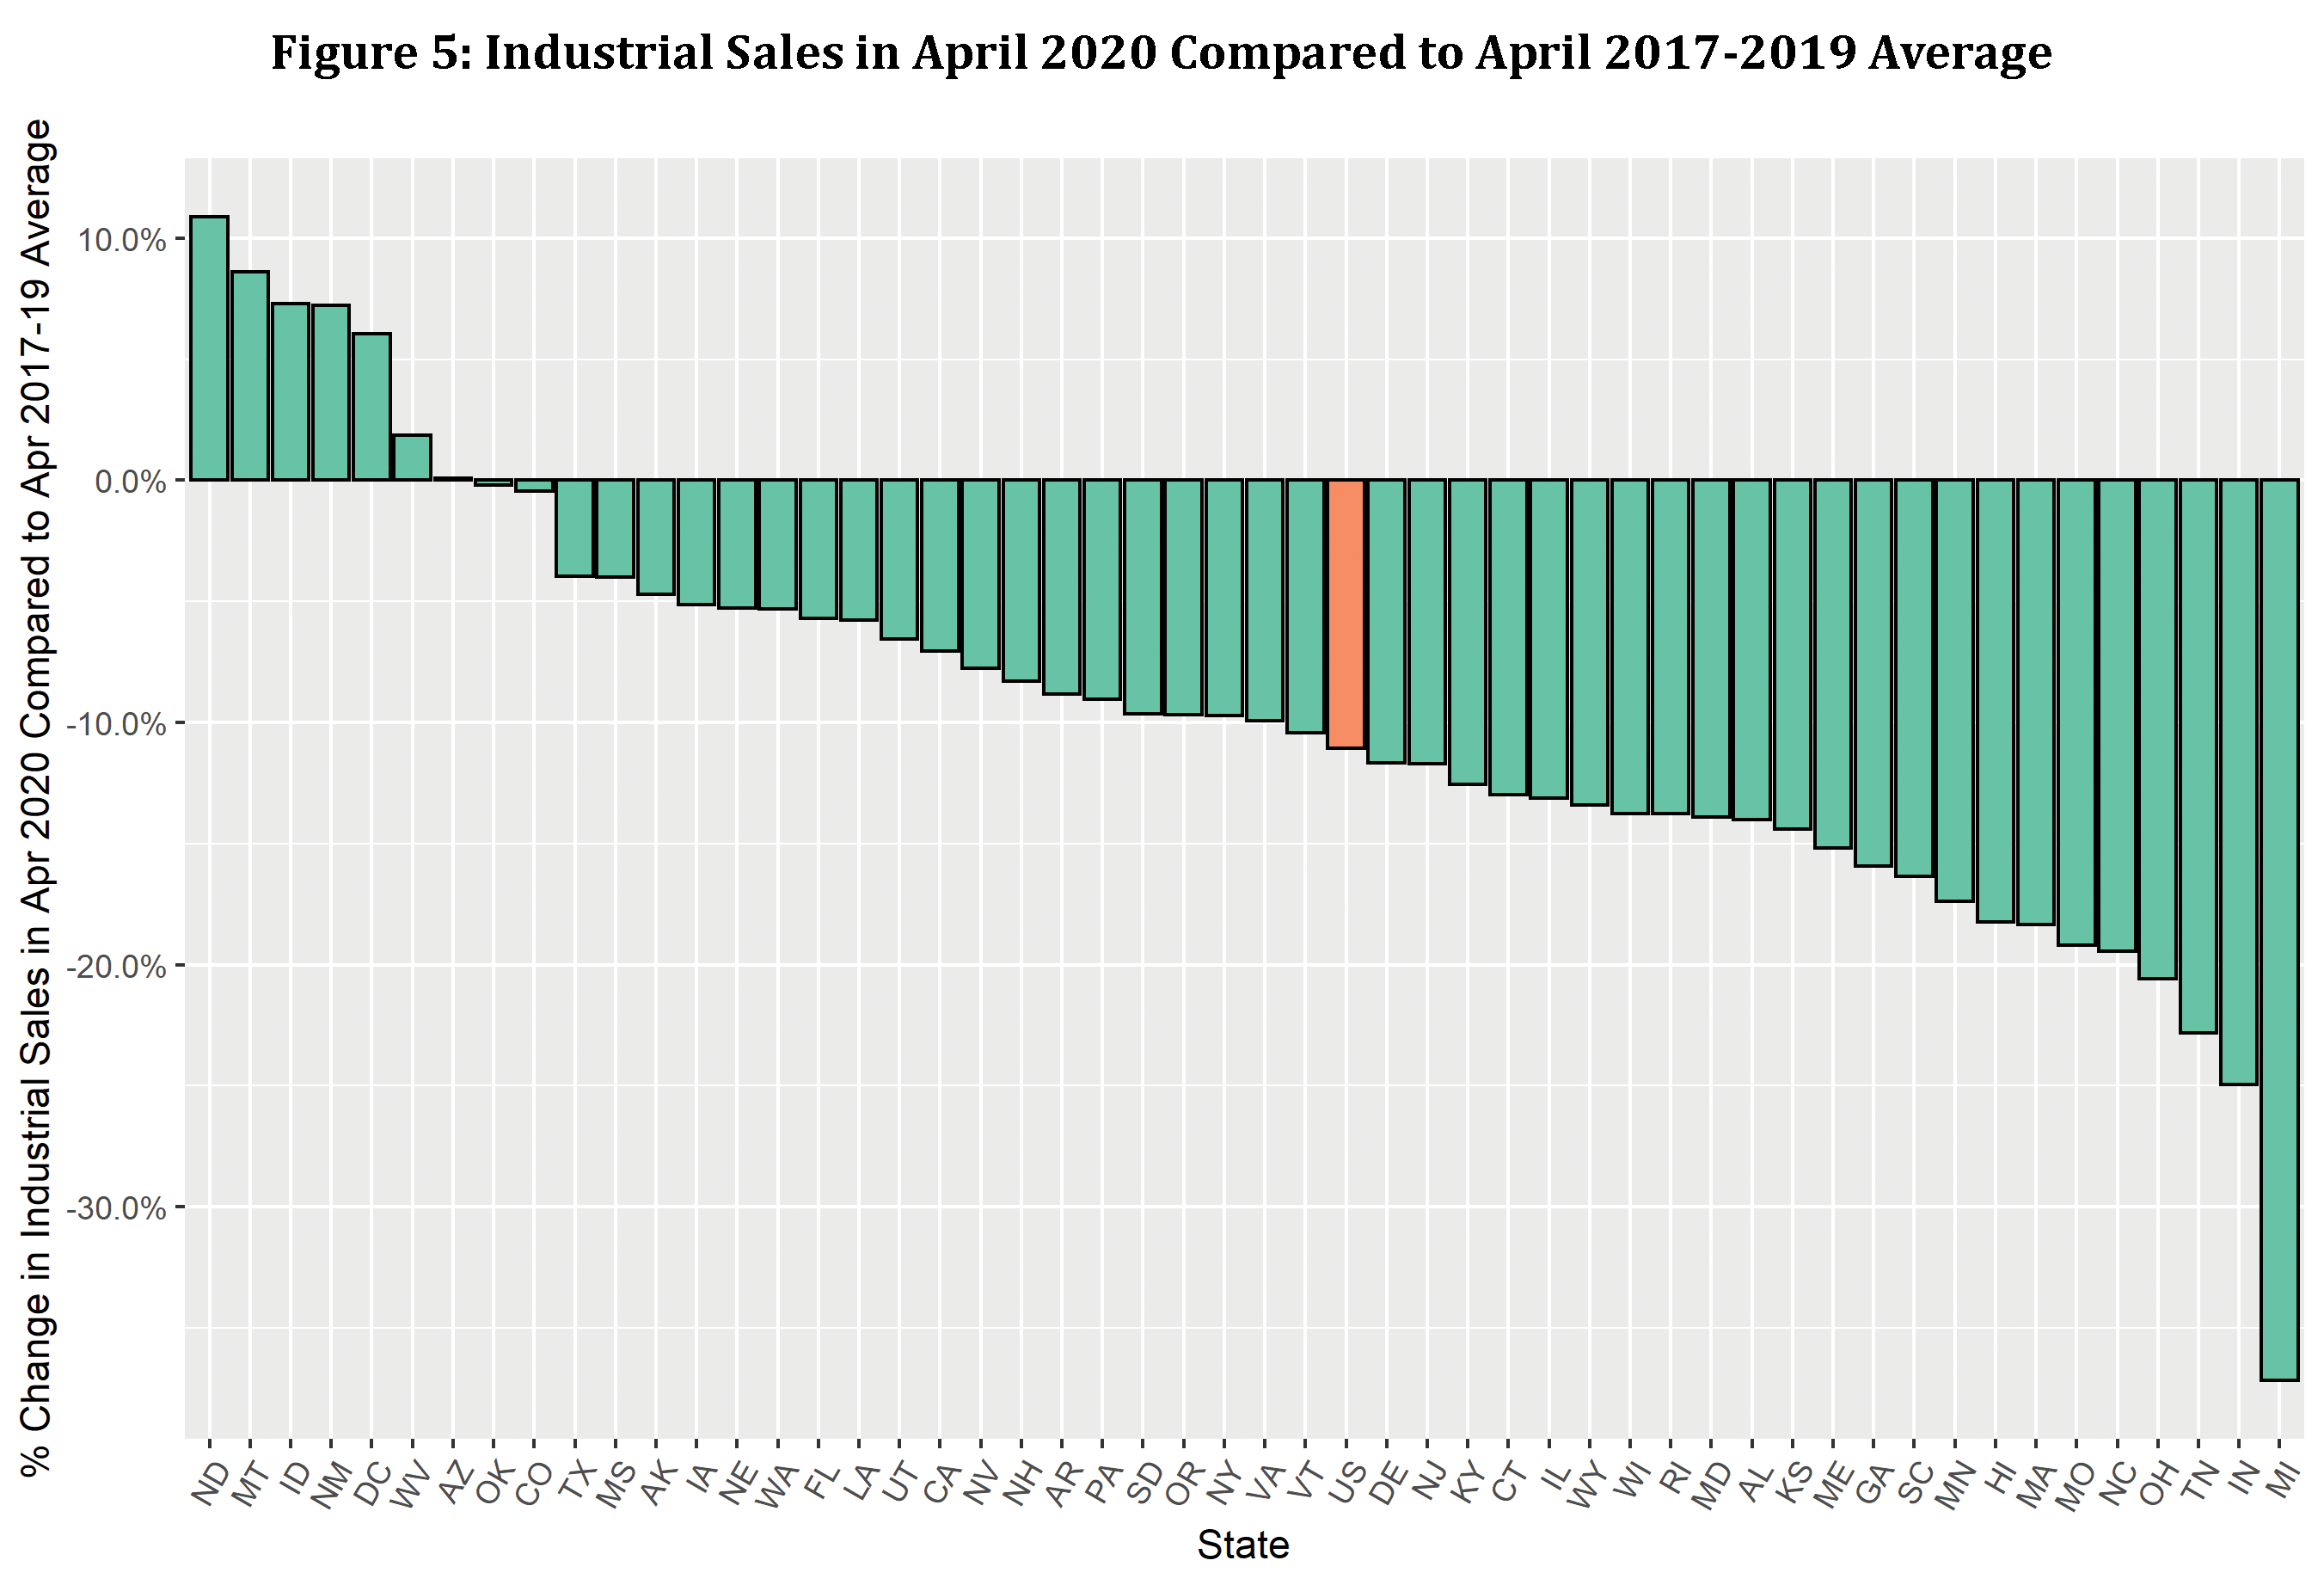
We can learn more by looking at sales patterns at a more granular level. We examined sales in April 2020 for each sector compared to the sales for the same month over the past five years at the state level. Generally speaking, the results were as expected for the commercial and industrial sectors. For most states, April 2020 had the lowest sales from commercial and industrial sectors when compared to the last five Aprils due to the slowdown caused by the pandemic. The April 2020 sales were 16% and 12% lower than April 2019 sales for the commercial and industrial sectors, respectively. The chart below shows commercial sales in each of the last four Aprils by state.
April 2020 versus Average April 2017-2019
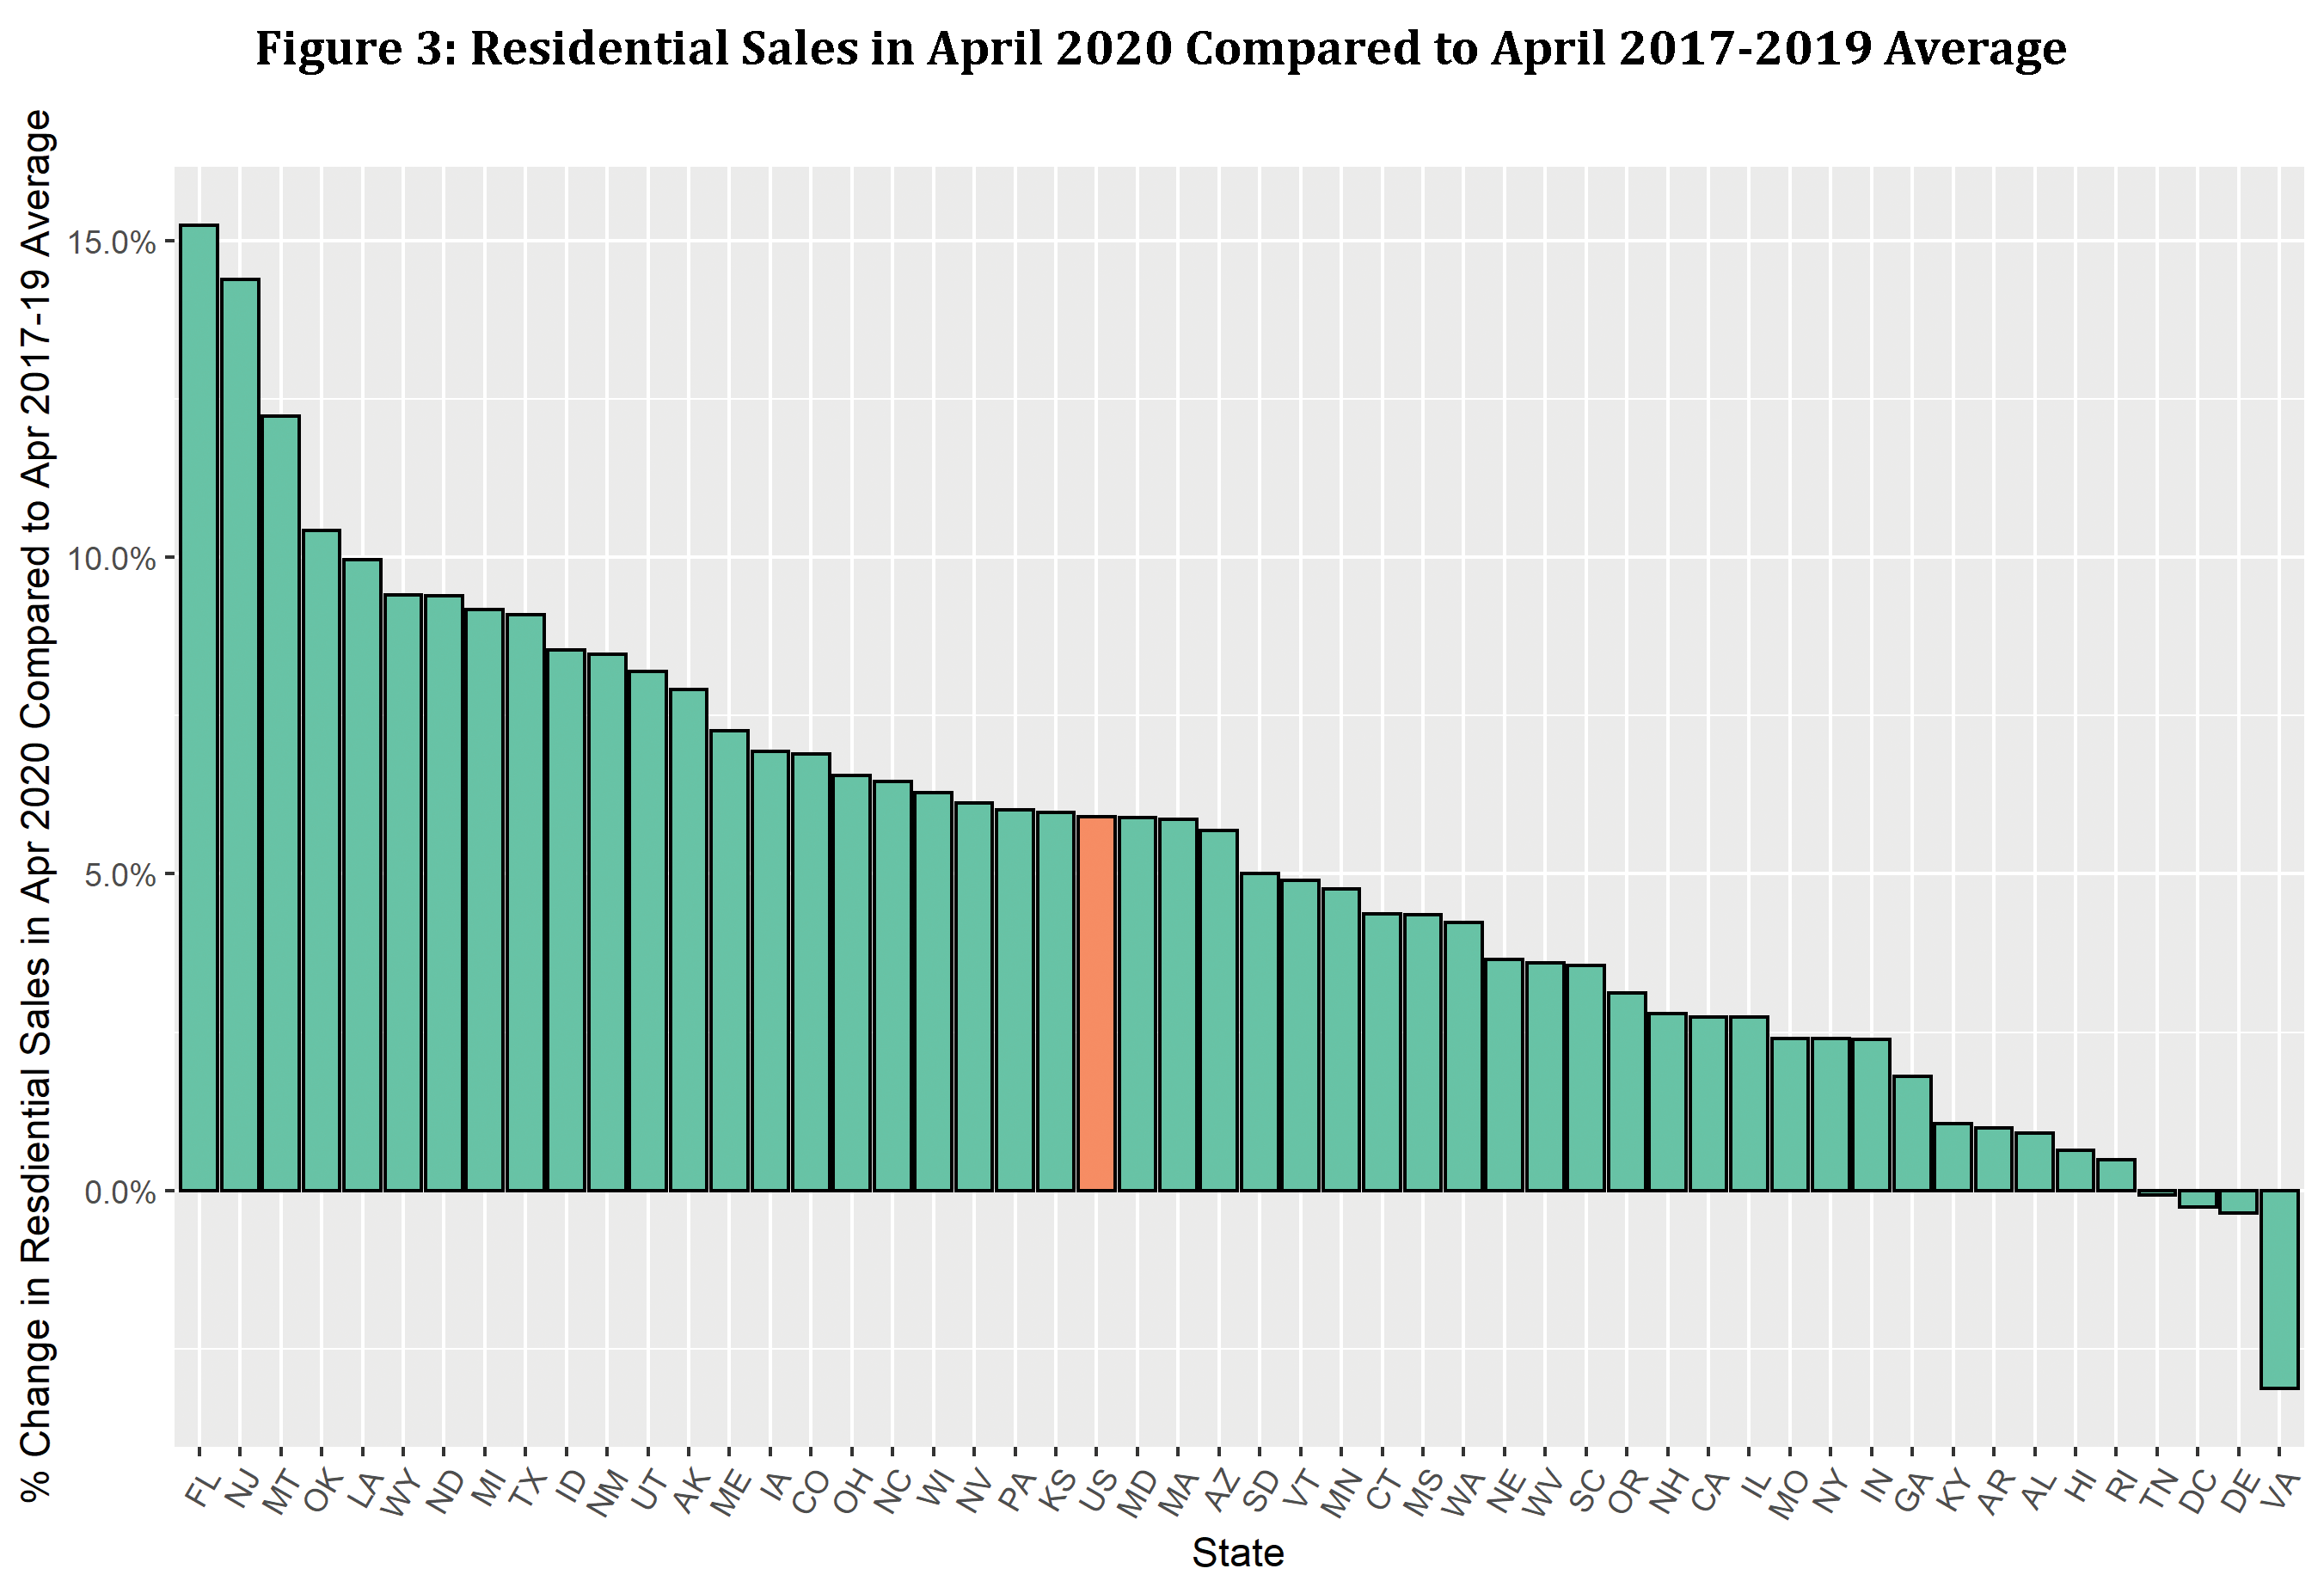
We wanted to analyze how April 2020 sales compared to the average April sales in the prior three years (i.e., 2017-2019) for each sector. As shown by the graphs below, April 2020 sales for the residential sector was higher than the April 2017-2019 average sales for all but four states. The percentage change in sales ranges from a high of approximately 15% to a low of roughly -3%.
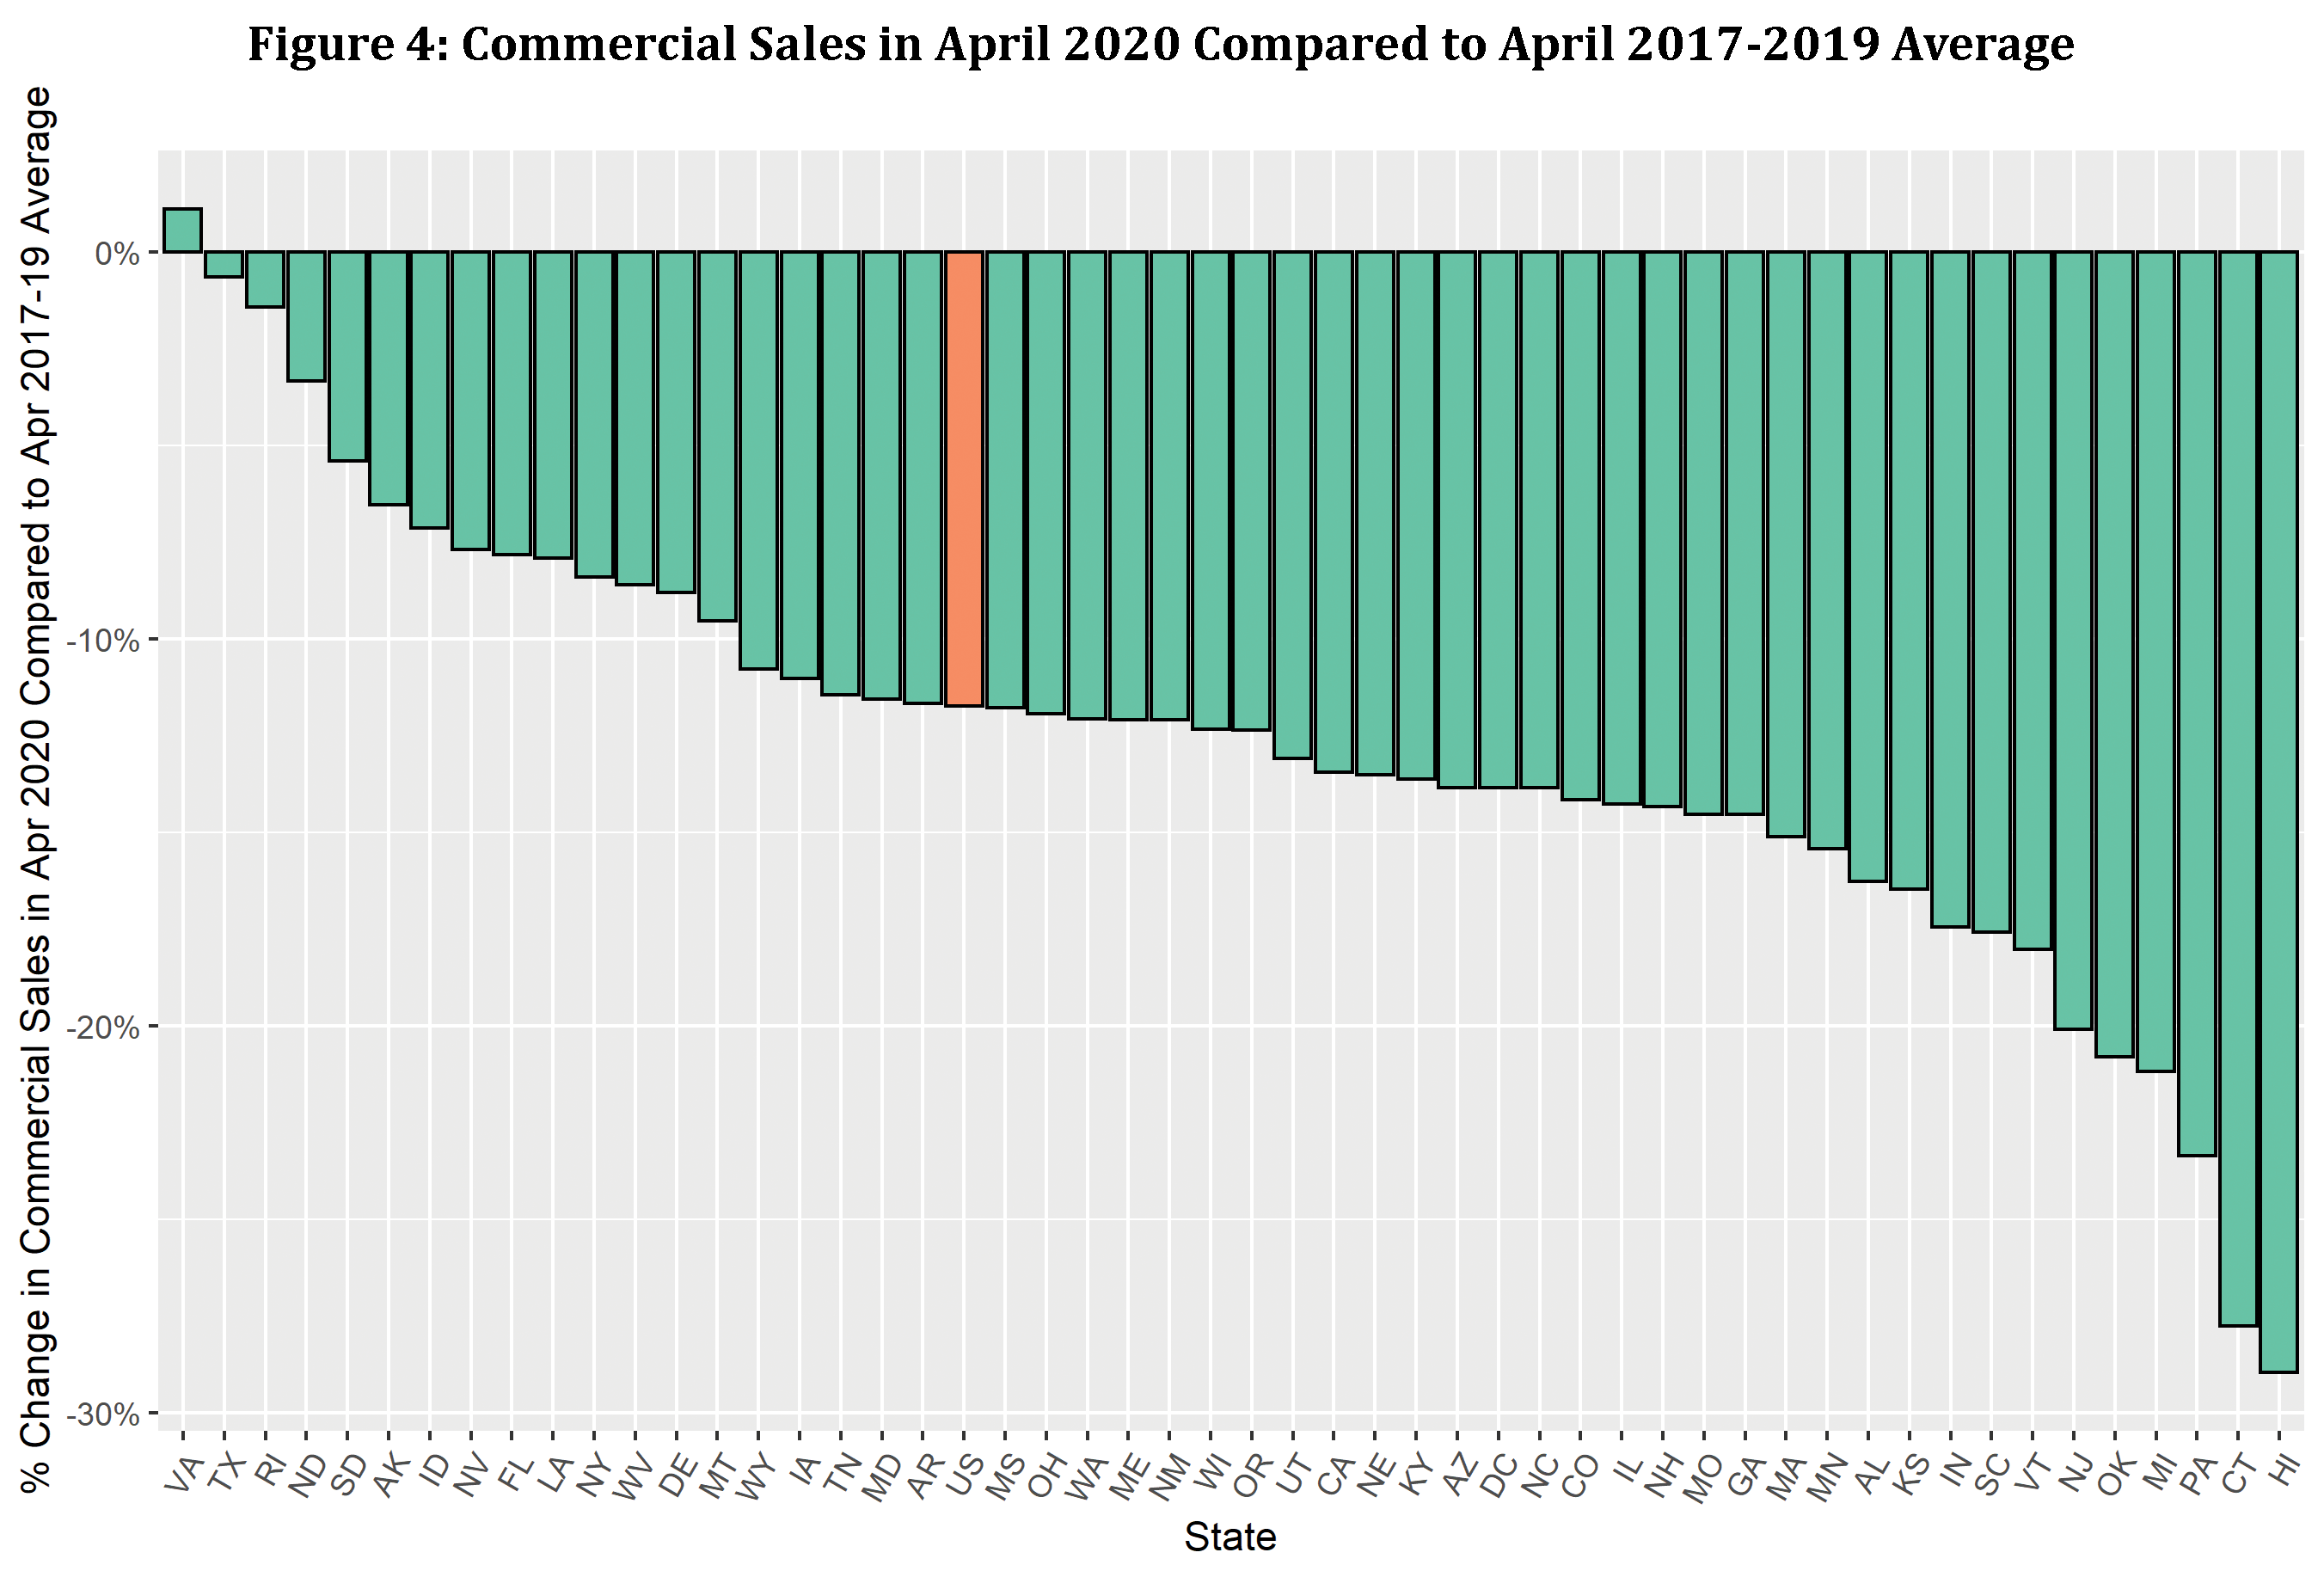
April 2020 sales rates for the commercial and industrial sectors were lower than the April 2017-2019 average sales for all but one state for the commercial sector and all but seven states for the industrial sector.
Revenue Impact of COVID-19
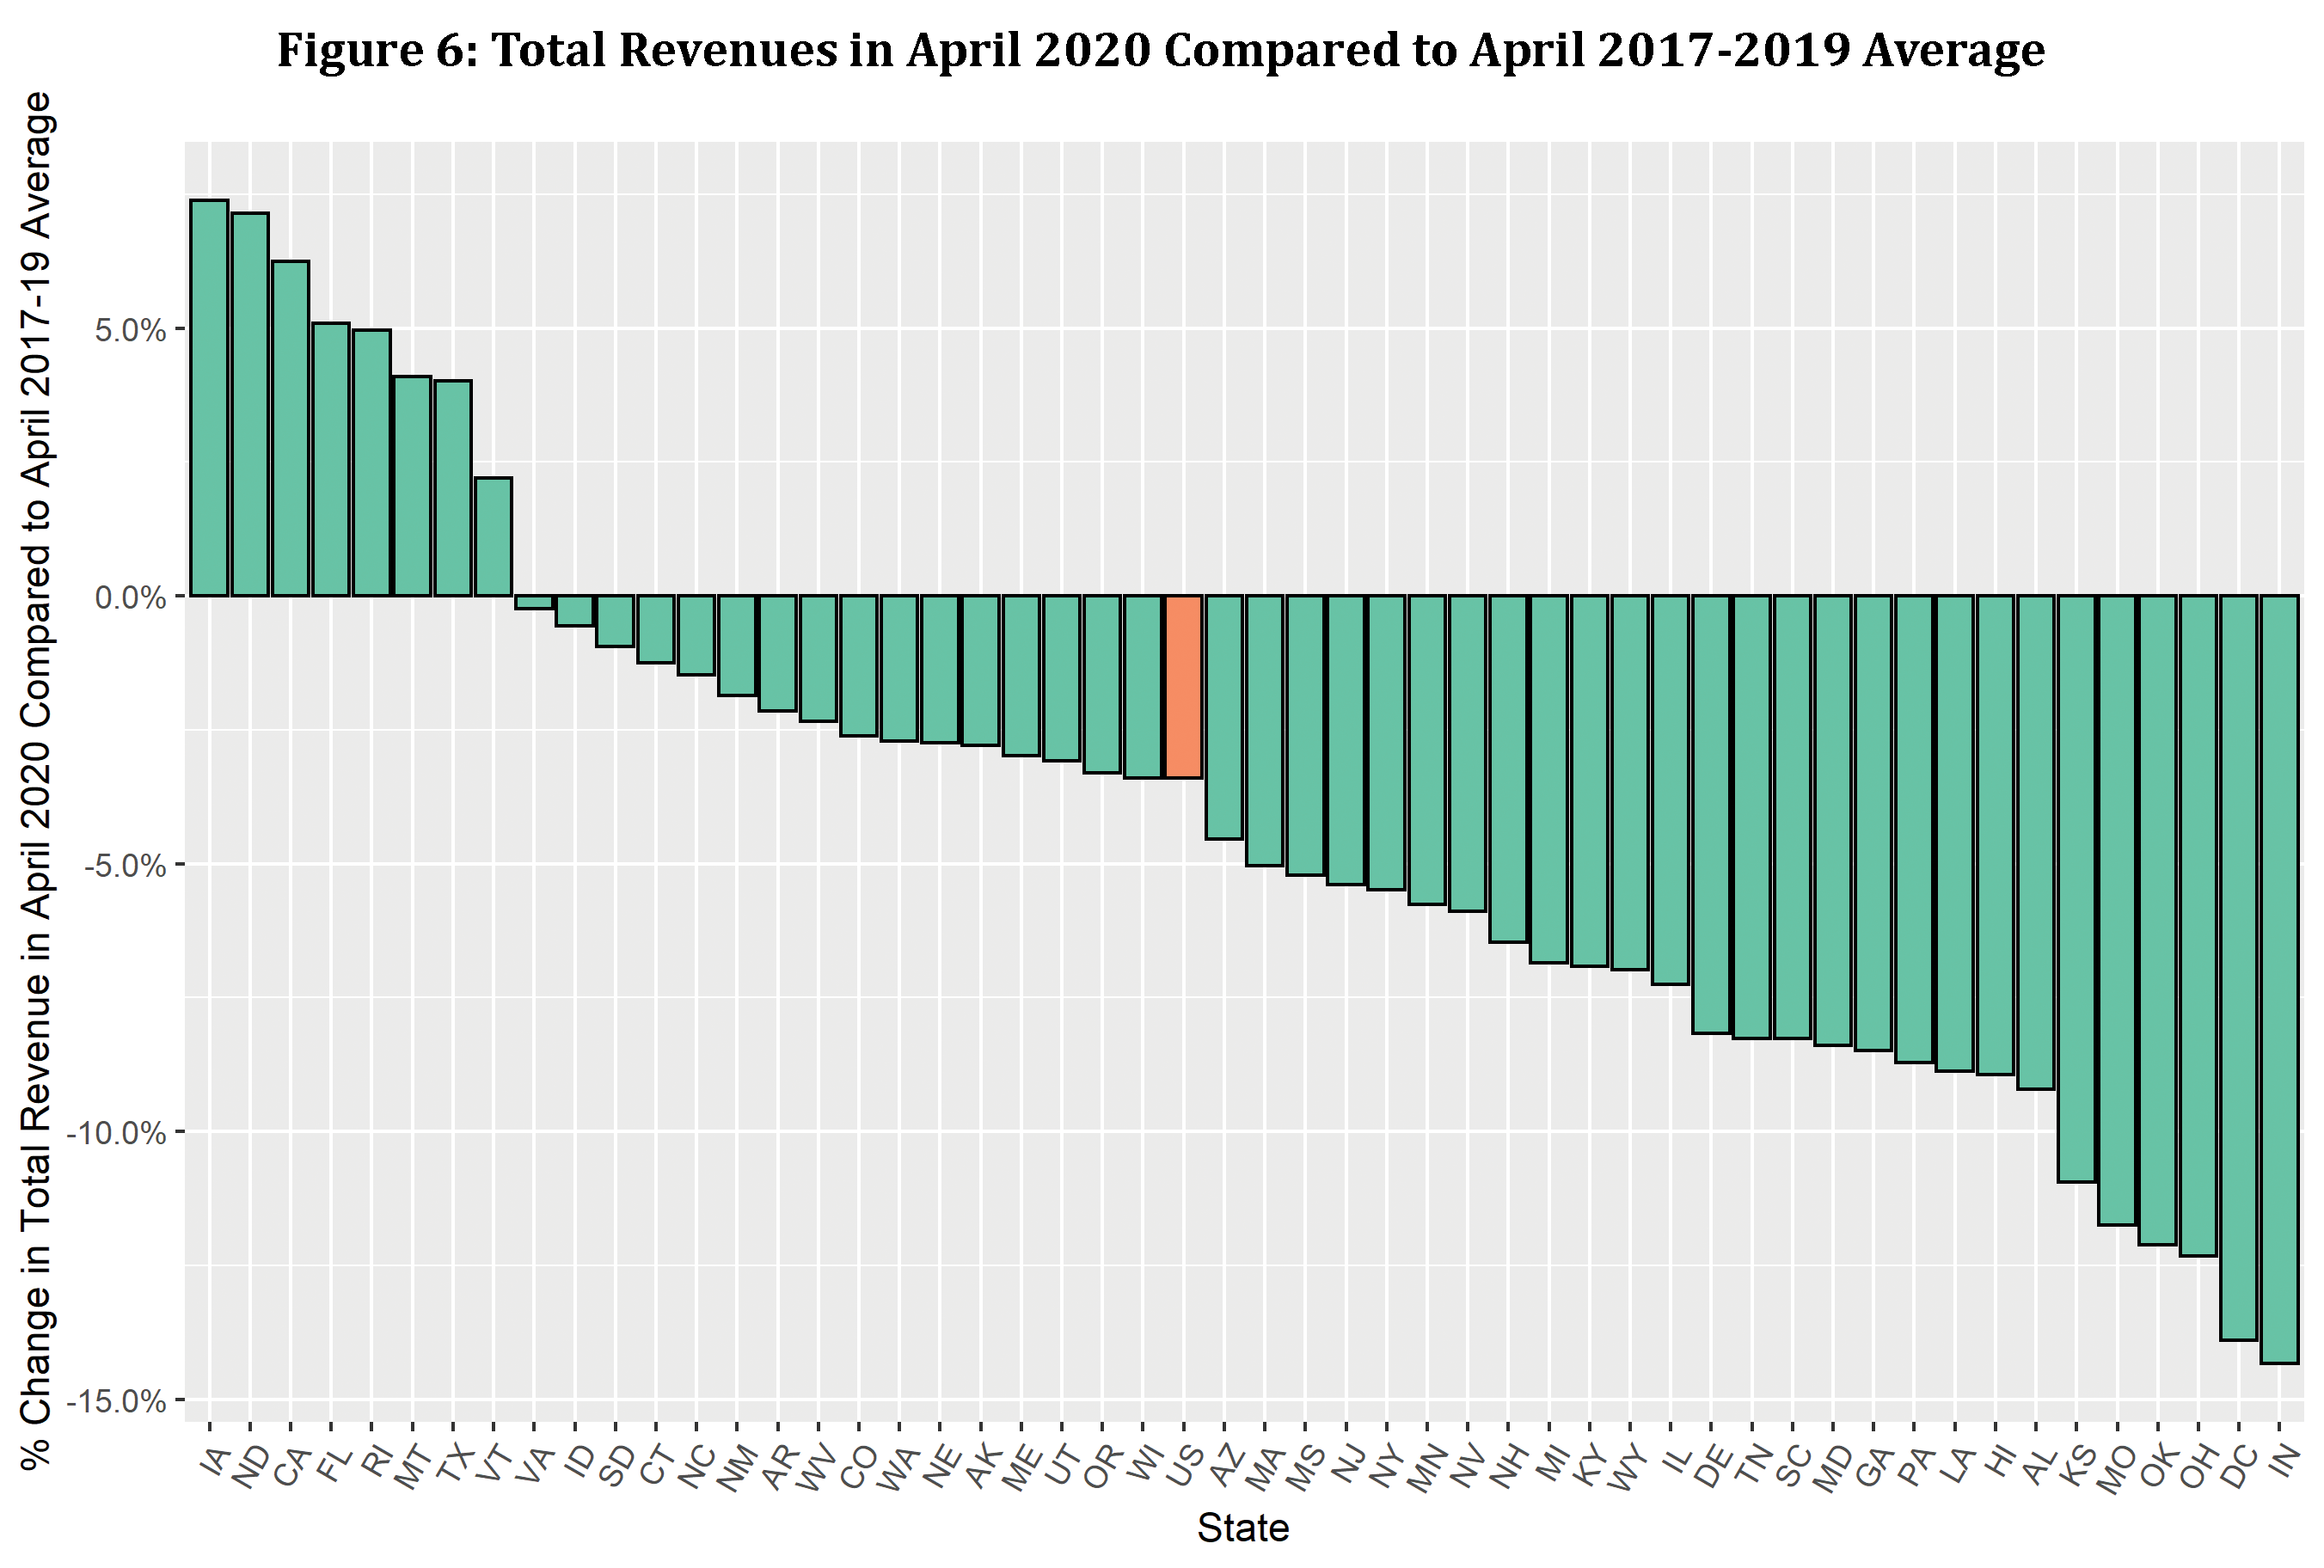
After establishing that residential sales had moved in the opposite direction to commercial and industrial sales, we analyzed the overall net impact on the revenues collected. We examined how much, if any, the loss in revenues from the commercial and industrial sectors would be offset by the increase in revenue from the residential sector. When we compared the change in total April 2020 revenues to the average April revenues in 2017-2019, the change in revenues followed a similar pattern as the change in total sales. It is important to note that non-payments may be driving a portion of the reduction in total revenue in April 2020 in addition to reduced load.
The critical question is: how will the change in load driven by the pandemic impact regulated utilities? The answer depends on each utility’s unique circumstances, some of which are listed below:
- Rate Design and Structure: Utilities that have the most misalignment between rates and cost structures will be impacted the most. All else equal, utilities that have rate structures that recover a significantly disproportionate share of fixed costs in volumetric rates will be impacted the most.
- Revenue/Rate Adjustment Mechanisms: Utilities that have automatic revenue/rate adjustment mechanisms, including revenue decoupling mechanisms, formula rate plans, and multi-year rate plans, will be less impacted and possibly able to more effectively recover their fixed costs than the utilities that currently don’t have these mechanisms. However, the amount and the timing of recovery will depend on the design of each of these adjustment mechanisms.
- Customer Composition: This change in load will negatively impact utilities that have a significantly higher proportion of sales from commercial and industrial sectors relative to the residential sector.
As next steps, we plan to analyze monthly data beyond April 2020 as it becomes available. The data for these later months, especially the summer months, will be crucial because those are the peak electricity sales months and peak revenue collection months. Drastic changes to sales during the summer months will have significantly more impact on revenues as compared to the months. Additionally, we also want to explore the various options available to utilities, regulators, and other stakeholders to address the COVID-19 related issues discussed herein.
More From Concentric:
All views expressed by the author are solely the author’s current views and do not reflect the views of Concentric Energy Advisors, Inc., its affiliates, subsidiaries, or related companies. The author’s views are based upon information the author considers reliable. However, neither Concentric Energy Advisors, Inc., nor its affiliates, subsidiaries, and related companies warrant the information’s completeness or accuracy, and it should not be relied upon as such.
[1] Data was obtained from EIA using EIA’s API and the analysis was conducted in R, a free statistical software. The data used in this analysis is based on Form EIA-861M “Monthly Electric Power Industry Report”, which collects sales of electricity and associated revenue, each month, from a statistically chosen sample of electric utilities in the United States.