Concentric Recently Served as Market Advisor in Key Basalt Infrastructure Partners Acquisition

Solar panels and solar farm with sunrise or sunset

Published on November 20, 2020

Michael Kagan, Senior Vice President at Concentric, recently led a team that served as Market Advisor to Basalt Infrastructure Partners LLC (“Basalt”). In this capacity, Concentric supported an investment by Basalt Fund III in a residential solar portfolio owned by funds managed by Ares Infrastructure and Power. This transaction is notable in that it includes approximately 11,000 existing residential solar installations and the capacity to support additional solar installations across the US through a new entity, Habitat Solar.

As Basalt’s Market Advisor, Concentric evaluated state-level regulations pertaining to net energy metering, the supply-demand balance of solar renewable energy credits in various states, and anticipated regulatory changes that will impact the economics of the residential solar market in the coming years. “With so many transactions contemplated within the on-site solar space, it’s great to support a client executing on a platform investment with long term growth potential,” said Michael Kagan.

In addition to assisting Basalt, Concentric has recently assisted numerous other clients complete acquisition due diligence, including advising a solar developer in the acquisition of a retail power and gas supplier, advising several private equity investors in their acquisitions of retail energy providers, and assisting utilities evaluate investments in the energy efficiency space.

Concentric is often selected for these engagements given our capability to quickly mobilize an experienced team that has a comprehensive understanding of the competitive energy landscape and wholesale and retail energy regulations, and an understanding of the specific diligence needs of debt and equity investors.

More information is available regarding Concentric’s due diligence and retail services here.

Leveraging Competitive Markets to Unlock the True Value of AMI

Distribution electric substation with power lines and transformers, at sunset

Published on October 27, 2020

An important new report authored by Michael Kagan for the R Street Institute indicates that leveraging the use of Advanced Metering Infrastructure (AMI) in competitive markets could potentially save $250 million per year for residential consumers currently on competitive supply while also reducing energy consumption, improving grid resiliency and supporting new products and services for consumers. To achieve these goals, regulatory commissions must require that both new and existing AMI implementations provide retail suppliers revenue-grade customer usage data on at least a daily basis.

AMI has the potential to empower consumers to better manage their electricity usage and select competitive rate plans that best meet their needs. In developing the report’s conclusions, recent research and various market trends were considered. This research included a survey conducted by the American Council for an Energy-Efficient Economy (ACEEE) of the energy savings achieved in existing time varying rate programs. Recent trends considered include new competitive supply products and advances in the use of real-time AMI data.

“Achieving this level of savings will require regulatory commission actions that ensure competitive market participants have greater access to new and existing AMI investments so that they are able to create additional benefits for consumers and advance specific policy objectives,” stated Mr. Kagan, Senior Vice President, Concentric Energy Advisors.  “As we approach full AMI deployment in the United States, we have a unique opportunity to foster a series of innovations that will generate significant cost savings and environmental benefits for consumers. These direct savings in the competitive markets alone could top $250 million per year for residential consumers and we could realize far greater savings from deferred utility investment and the environmental benefits of reductions in demand peaks.”

The report was produced for the R Street Institute. Mr. Kagan extends his gratitude to R Street Senior Fellow Michael Haugh for his contributions to the report.

Pipe Replacement for a Decarbonized Future

Published on August 19, 2020

By: Alexander Cochis, Project Manager and Javier Sola, Consultant

Environmental advocates are challenging whether it makes sense to continue with existing pipe replacement programs, arguing that the industry is investing in rate base that will be stranded long before it is fully depreciated.

Key Considerations

A pipe replacement framework that incorporates uncertainty attributable to:

Will meet the challenges of a changing environment.

A New Investment Framework

The existing pipe replacement decision-making process focuses on how fast LDCs can replace at-risk pipe and how best to prioritize and execute their pipe replacement programs. These decisions are driven by federal mandates and subject to oversight by state utility regulators that are concerned about safety and cost. Environmental advocates are opposing new pipelines but also suggesting that LDCs should be at risk for future pipe replacement investments, as they increasingly focus on gas planning processes and decisions. Regulators recognize that pipeline safety is paramount. How can LDCs adjust the decision-making framework to support pipe replacement decisions? Our current assessment is that the degree of policy change, technological advances, and the costs of alternatives or substitutes to natural gas all play a role in framing a response to the challenges of decarbonization on pipe investment decisions.

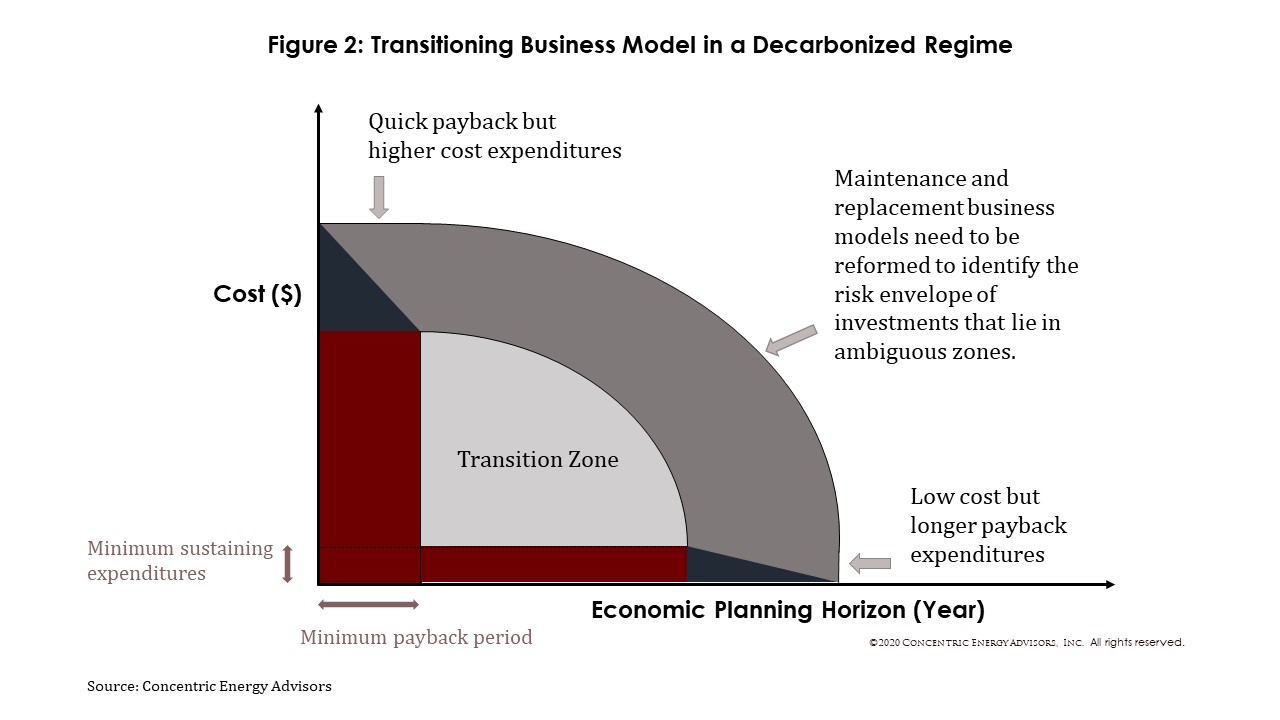
For a gas company to fulfill its public service mandate, it will make ongoing maintenance, monitoring, and operating expenditures to sustain the system and comply with safe operating practices (Figure 1). The LDC can also make investments to grow. As costs increase, operators will decide how long before those outlays are completely recovered.The Pipe Replacement Decision Framework in Figure 2 depicts areas that represent varying degrees of costs, recovery time, and risk for the project types in Figure 1.

Project types in the Pipe Replacement Decision Framework present risks that are the product of both the likelihood of being unable to sufficiently recover capital and the amount of capital exposed. The further investment decisions move away from the short payback and minimum expenditure programs, the closer decisions are framed by a “risk envelope” space depicted in the Framework. Trade-offs may begin to appear between lower cost pipe segments that have longer time horizons to recover capital (new branch lines with few customers) and larger capital investments with shorter paybacks (removal and replacements of entire mains in established and densely served areas). As undepreciated investments approach economic planning horizons or any other mandated useful lives, the potential for customer rate shock as obsolete capital is recovered or loss to shareholders from stranded cost presents an opportunity to look for innovative capital investment and recovery methods.

Decarbonization policies are likely to change the risk analysis. Environmental considerations may accelerate technological improvements toward lower carbon natural gas through targeted investments and state or provincial carbon intensity limits. While mandates and subsidies are by their nature distortive, they can also spur new delivery models. Power supply renewables, for example, are following a discernible cost decline as mandated investments lead to economies of scale.

Risk introduces elements of time-sensitive paybacks to traditional decision-making metrics like net present value, rates of return, and size of rate base. This may present more realistic prospects for pipe recovery for a gas company facing more ambitious decarbonization policies. The new investment decision framework should incorporate uncertainty. Decarbonization policy, the economics of electrification, customers’ preference to continue to use natural gas, and new safety protocols all change the investment views on how long new pipe will be needed.

Responses to Some Common Questions

Should the LDC continue, accelerate, or reprioritize its pipe replacement program?

Under the Pipe Replacement Decision Framework, the degree of decarbonization will be a significant driver of the answer to this question, with “net zero carbon” scenarios presenting the greatest risk, as will the timeline for phasing in the program. Pipe system integrity is regulated by the states, and federally by the Pipeline and Hazardous Materials Safety Administration (PHMSA) under the Distribution Integrity Management Program (DIMP). Given the duty to maintain a safe system, any decarbonization policy would need to support system safety to the extent the system or certain segments or subsystems remain in service. While an argument might be made for repairing, rather than replacing, the classes of leak-prone pipe (LPP) currently targeted under DIMPs, the trade-off would require careful risk analysis of the LPP in order to ensure that leaks are maintained on the system at a manageable level. Pipe replacement is usually triggered by integrity concerns or capacity needs. These investment decisions could be broadened to reflect decarbonization policies. Depending on the type of decarbonization policy adopted by the state, pipe programs may be reconfigured to include the consideration of the use of new technologies, including, for example, the use of geothermal district heating as an alternative to replacement of LPP lines.

If regulators place shareholders at risk for new pipe by ruling against stranded cost recovery, how can local LDCs manage that risk? 

A significant driver of the answer to this question will depend on the carbon scenarios mandated. Investment strategy will reflect the level of increased risk and the pace of decarbonization. Asset management and portfolios, market position, and performance metrics will shift in the LDC company space. Pipe investment moves from a series of cost of service approval exercises to a dynamic consideration of available alternatives, where market forces truncate useful lives, and the probabilities change once large investments are made.

For example, changes in public policy resulting in stranded costs would raise the business risk of the company and likely merit a higher allowed return. The degree of the decarbonization under new mandates would drive whether system investment strategy would change. To the extent that gas will still be needed for generation to balance higher levels of renewables that support decarbonization, for example, investment decisions may shift to supporting new generation rather than expanding residential service. If the decarbonization policy allows offsets, then investments could be made to support the offsets (e.g., reforestation programs) to maintain a status quo business plan in regulated operations. Should renewable natural gas (RNG) be available and competitive at scale and fall within the decarbonization policies, then a company could make investments to transition to RNG supplies.

Should the company propose a change to depreciation rates for existing or new pipe? 

Near-term increases in depreciation rates present ways to balance investment recovery with policy goals in an incremental manner and can be adjusted through a rate case, with due consideration to rate impacts. Future earnings levels could be relatively lower if decarbonization policy reduces rate base. For this reason, any change to depreciation or capital recovery must be made in concert with other variables such as rates of return, salvage costs, capital budgeting, or risk management. Higher depreciation rates would present a way to hedge some of the risk associated with the underutilization or early retirement of pipe. Should the type of decarbonization policy adopted lead to an early abandonment of pipe, then increasing the rate of depreciation would allow for the accelerated recovery of the investment, mitigating the risk of stranded assets.

All views expressed by the authors are solely the authors’ current views and do not reflect the views of Concentric Energy Advisors, Inc., its affiliates, subsidiaries, or related companies. The authors’ views are based upon information the authors consider reliable. However, neither Concentric Energy Advisors, Inc., nor its affiliates, subsidiaries, and related companies warrant the information’s completeness or accuracy, and it should not be relied upon as such.

COVID Impacts Depend on Sales Trends and State Ratemaking Policies

Published on August 6, 2020

By: Bickey Rimal, Assistant Vice President

The most recent electricity consumption data from the U.S. Energy Information Administration (“EIA”) reveals that the COVID-19 pandemic is significantly impacting electric utilities throughout the country. A continuing decline in sales during the peak summer period coupled with misaligned rate design and structures does not bode well for the utilities. The most adversely impacted utilities are those that:

U.S. Electricity Sales Since COVID-19

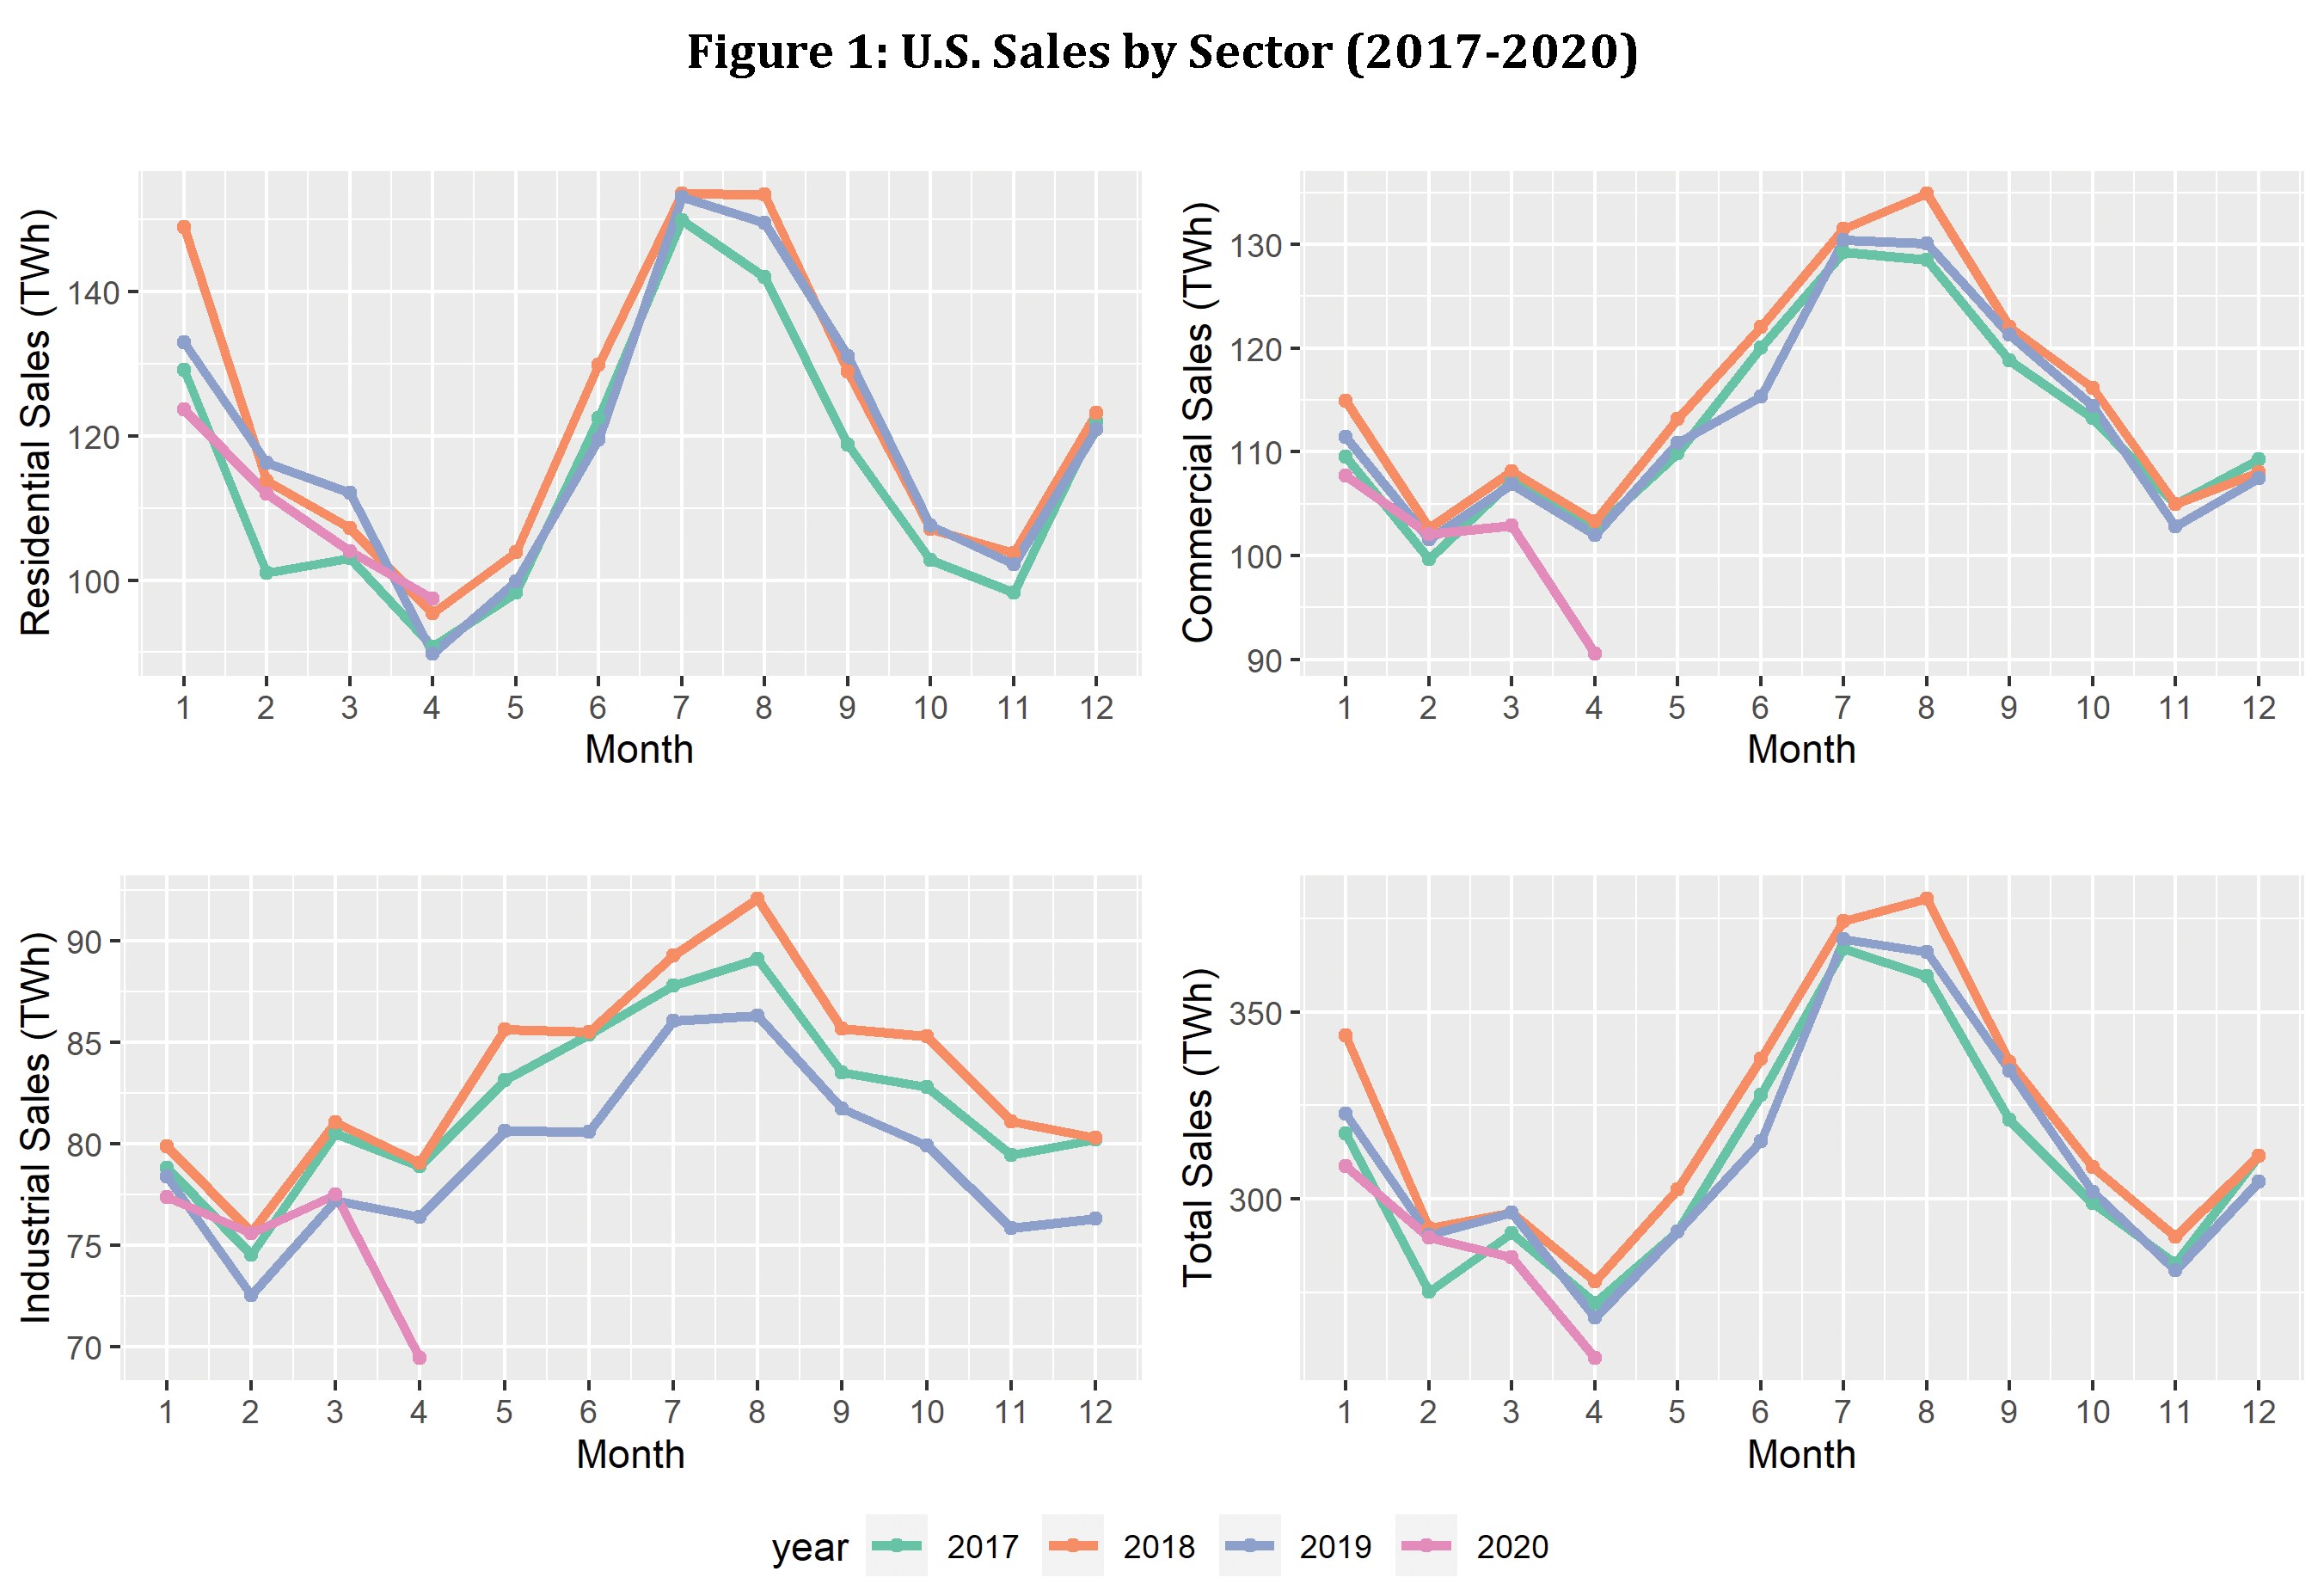
Based on the most recent monthly data published by EIA, total electricity sales in April of 2020 was the lowest level experienced since 2003, despite the fact that residential sales were their highest levels since 2001. [1] Commercial and industrial sectors experienced their lowest April sales since 2003. The following graph shows the monthly sales by sector over the last few years.

U.S. Utility Sales by Sector

State-Specific Sales Since COVID-19

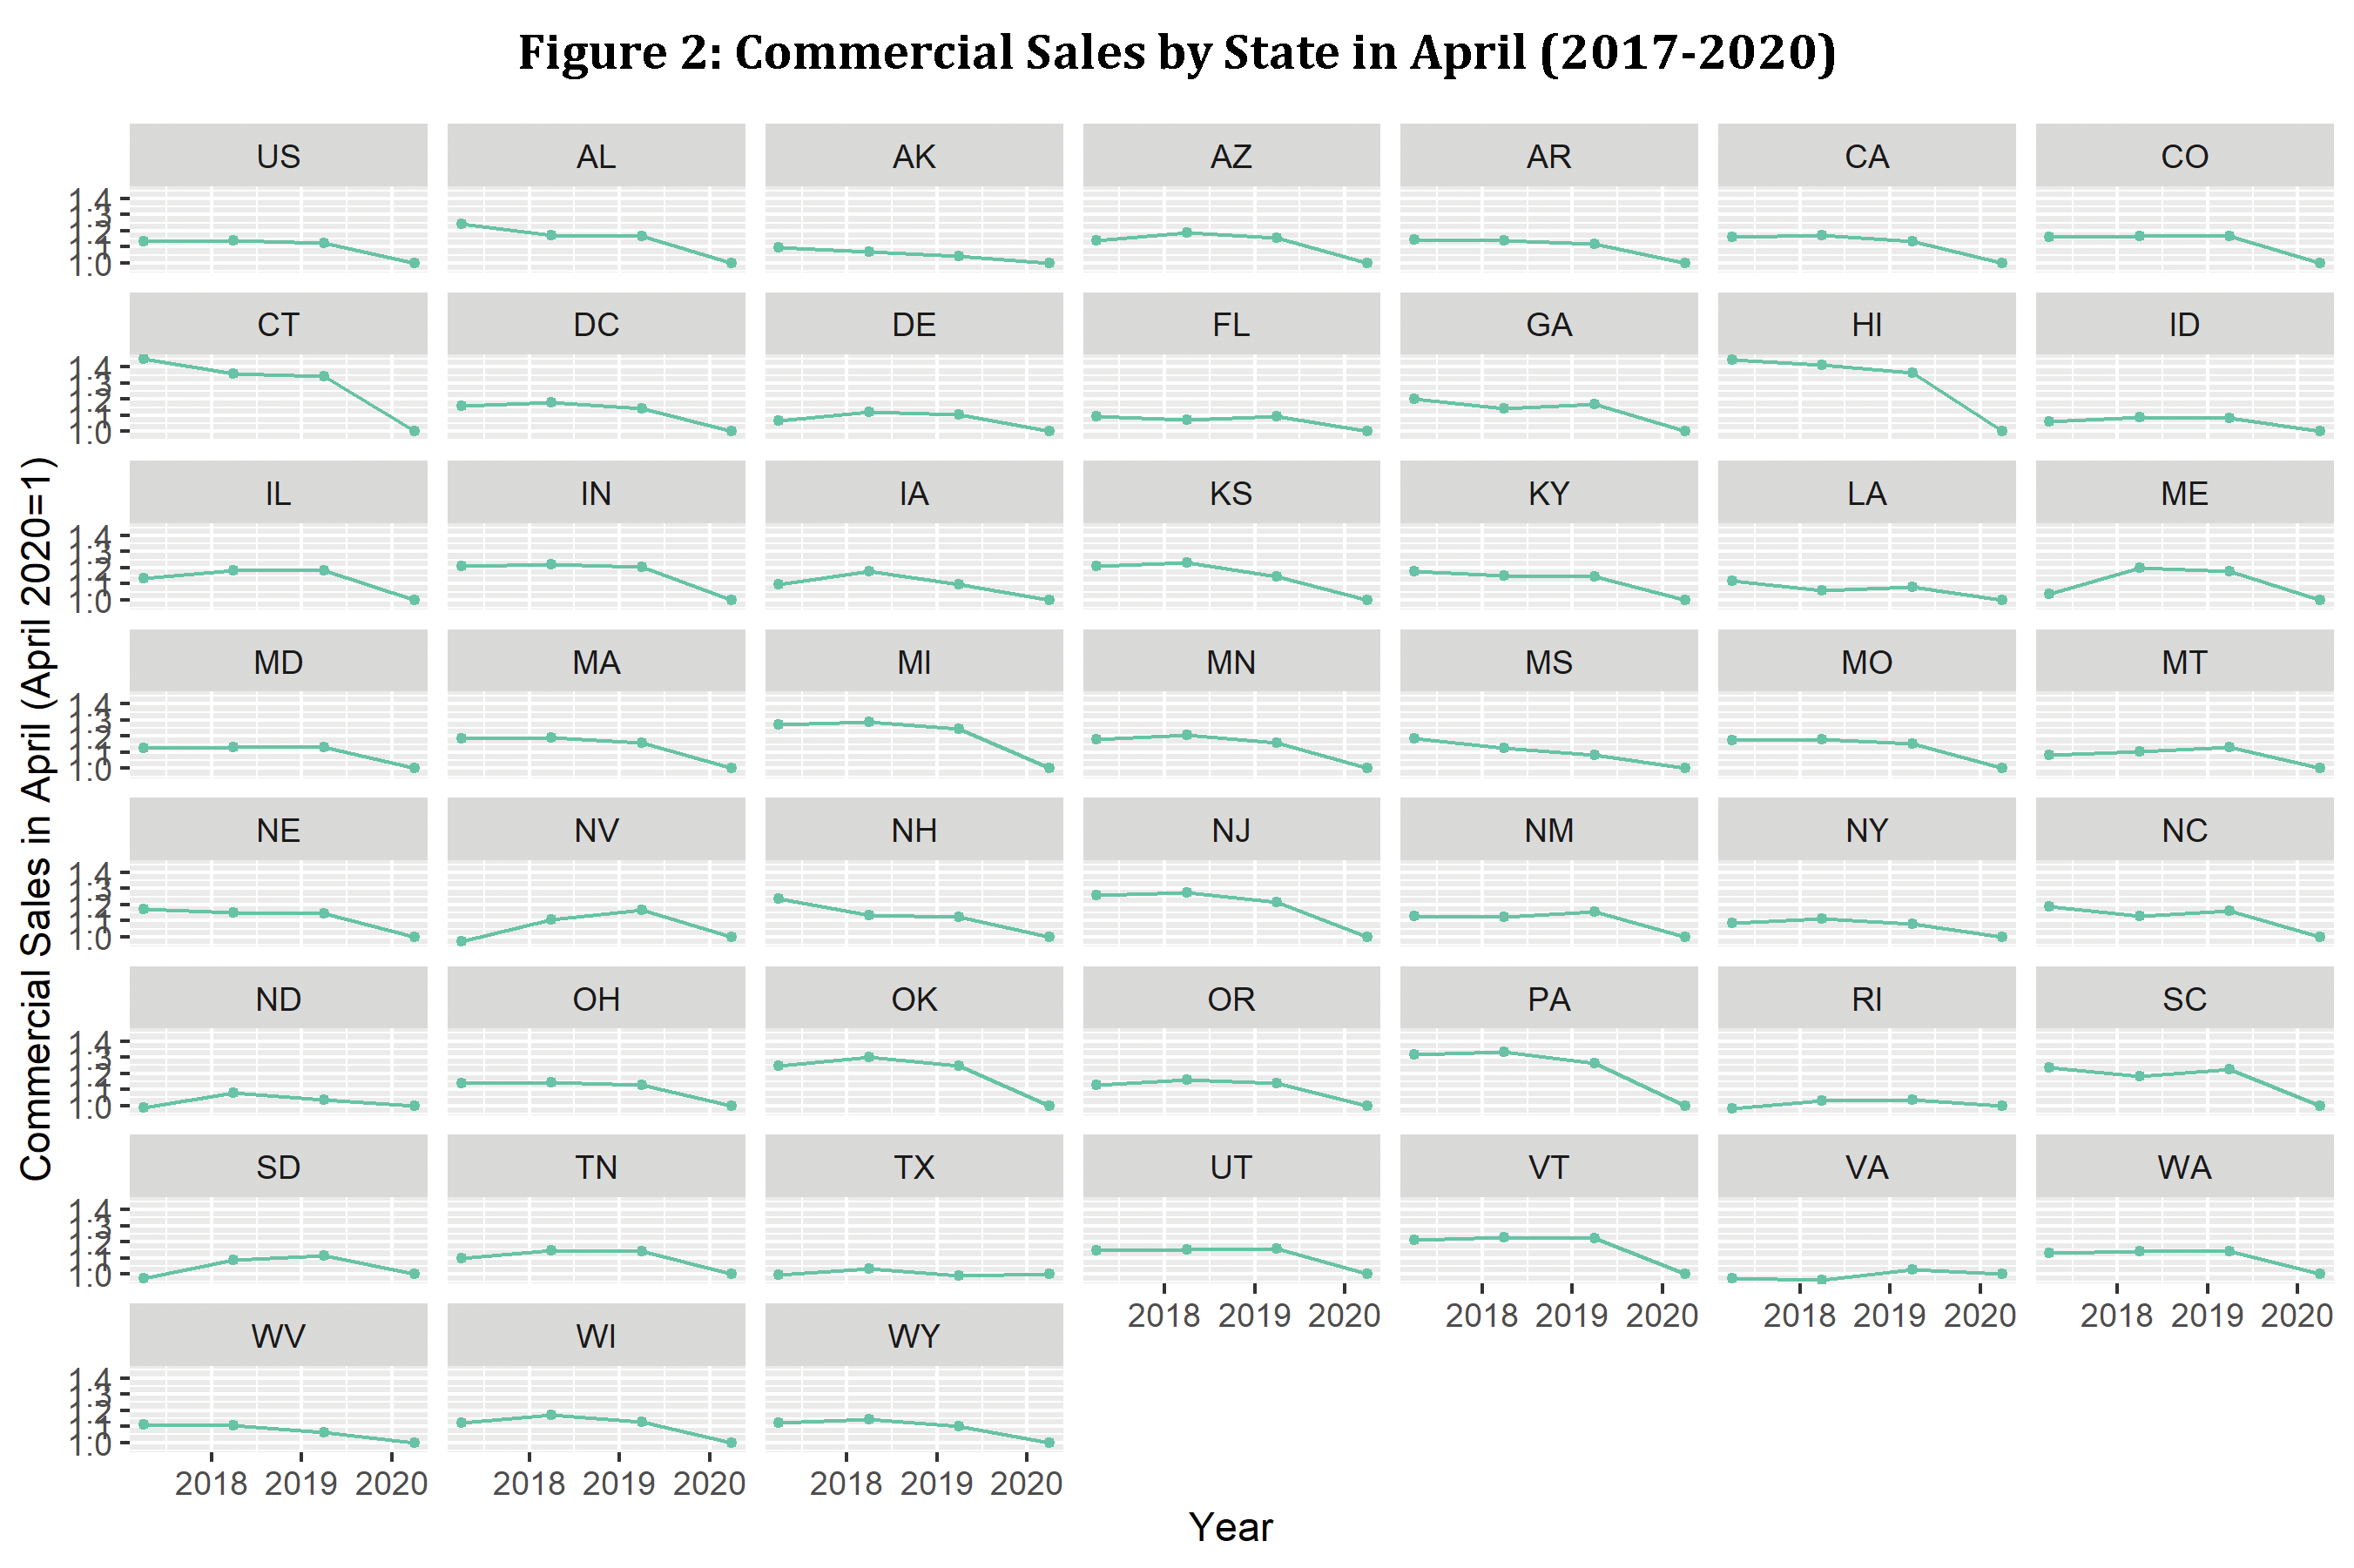
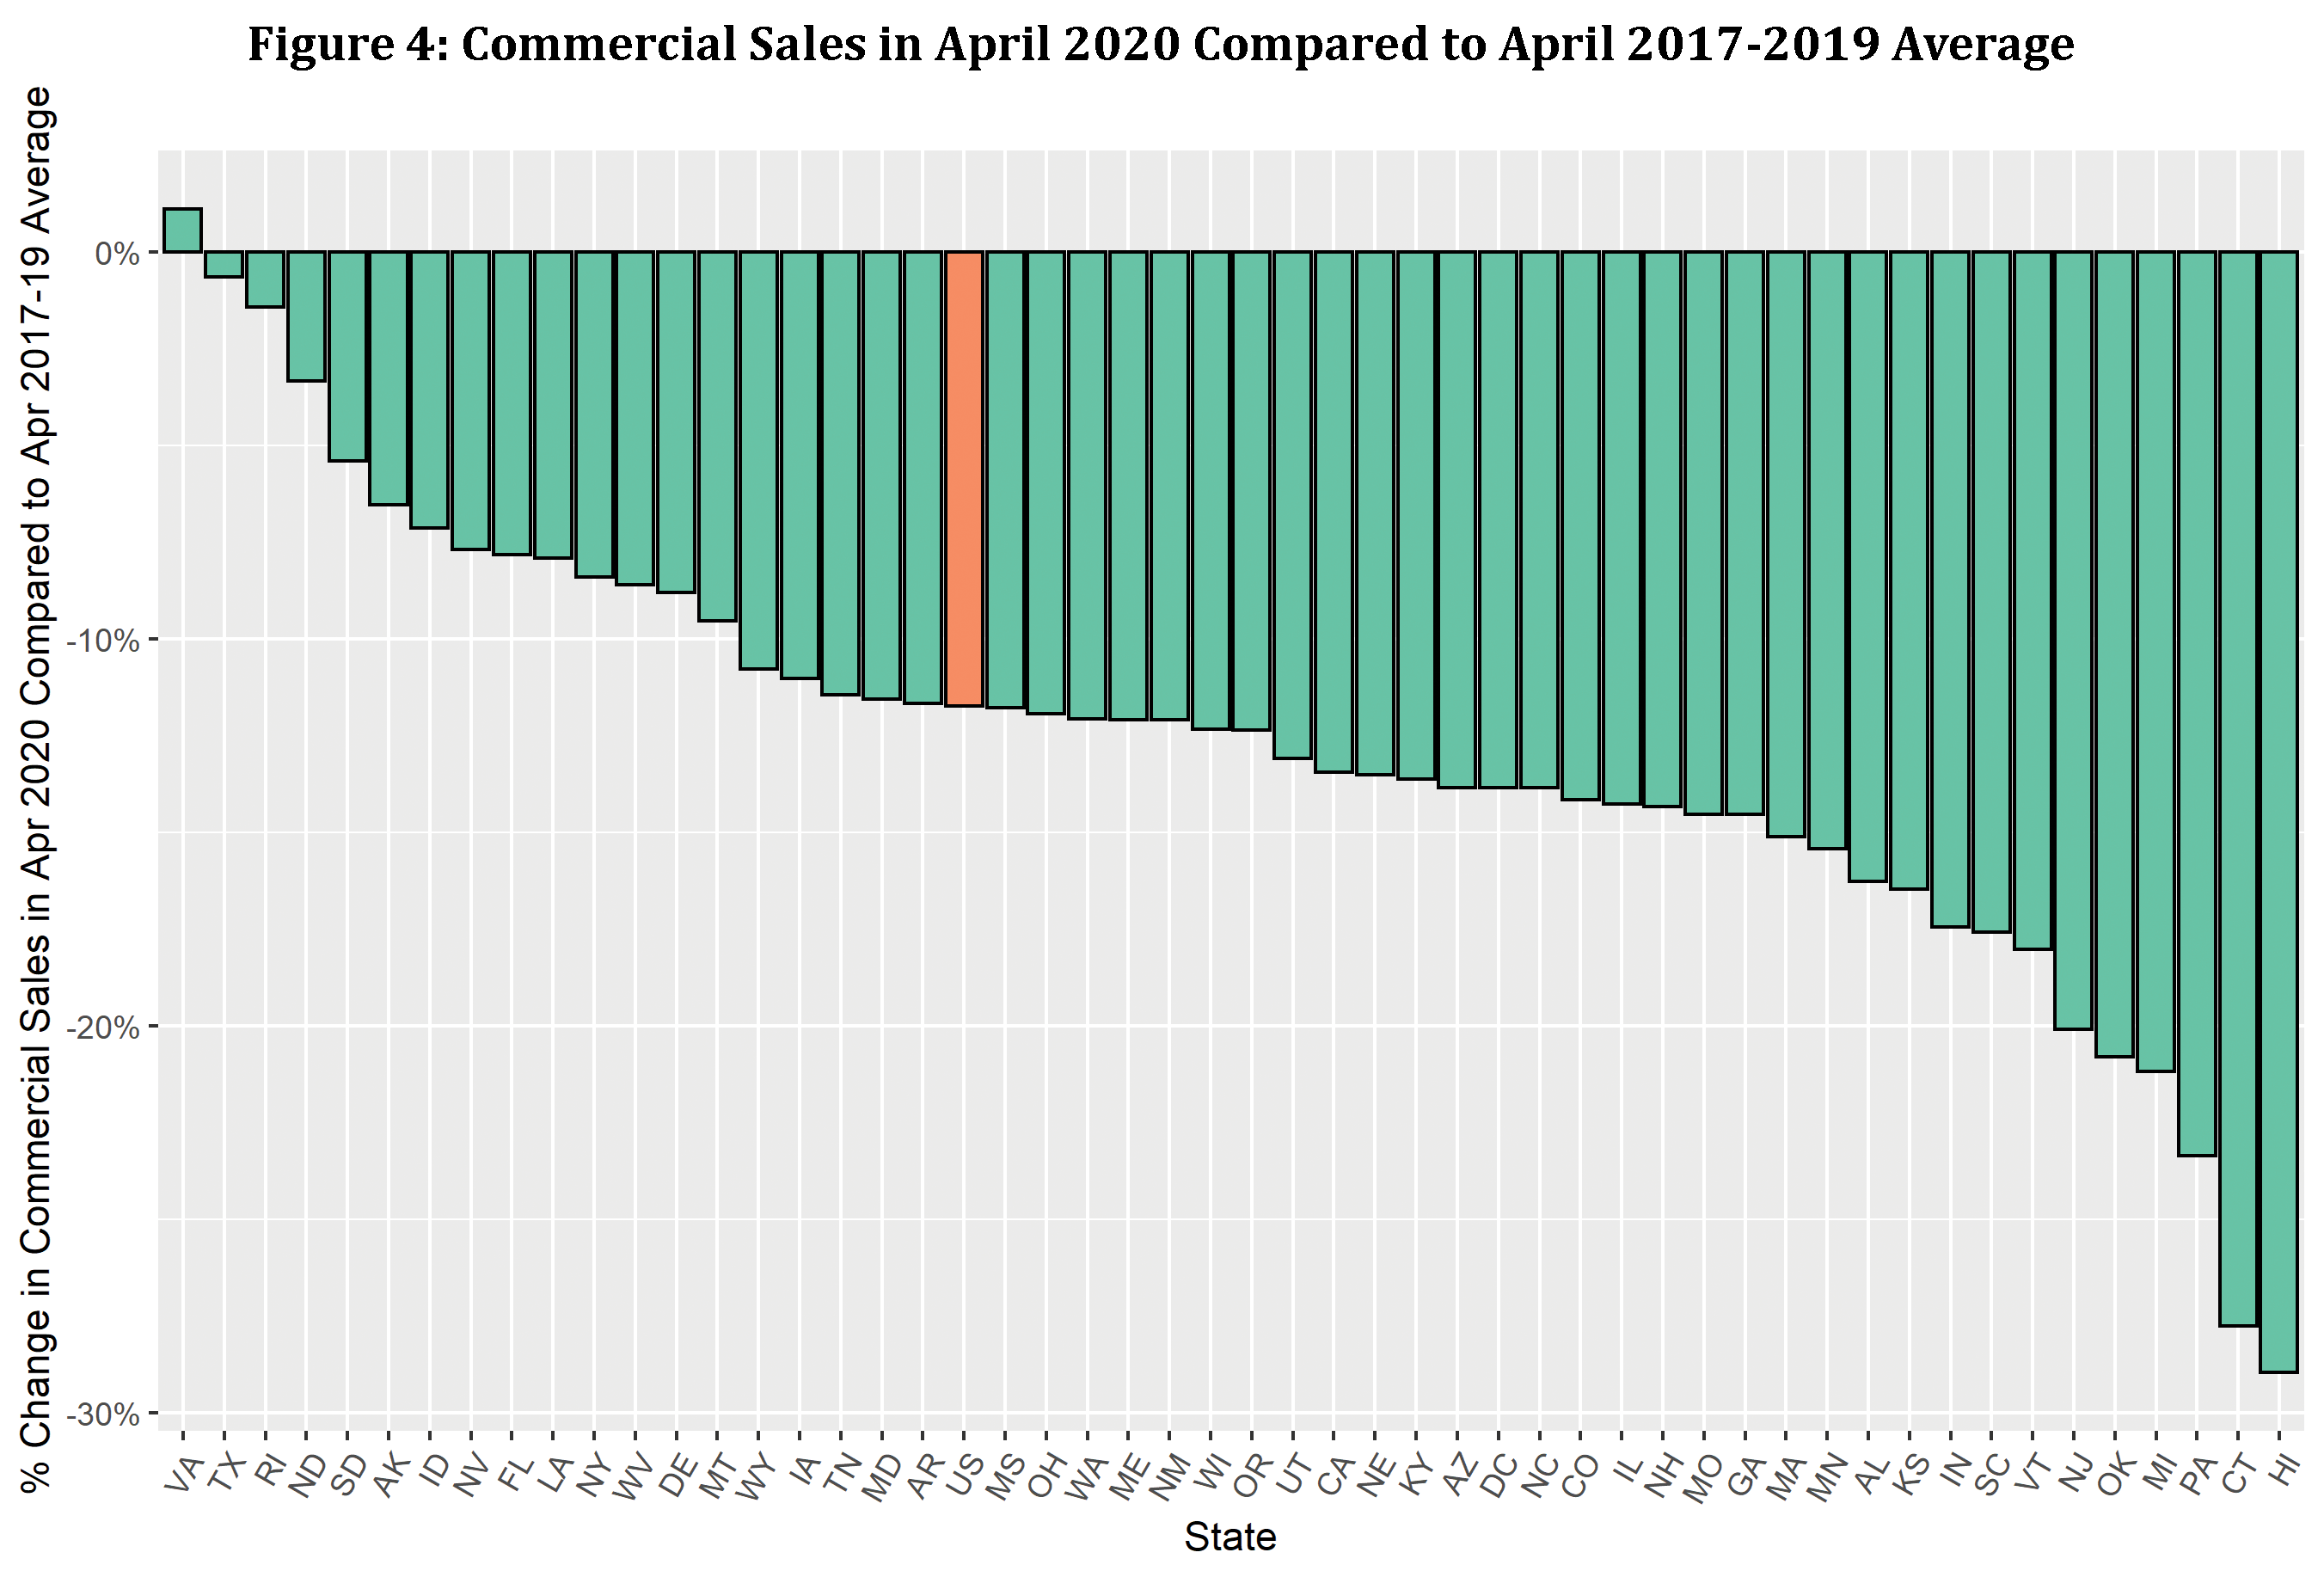
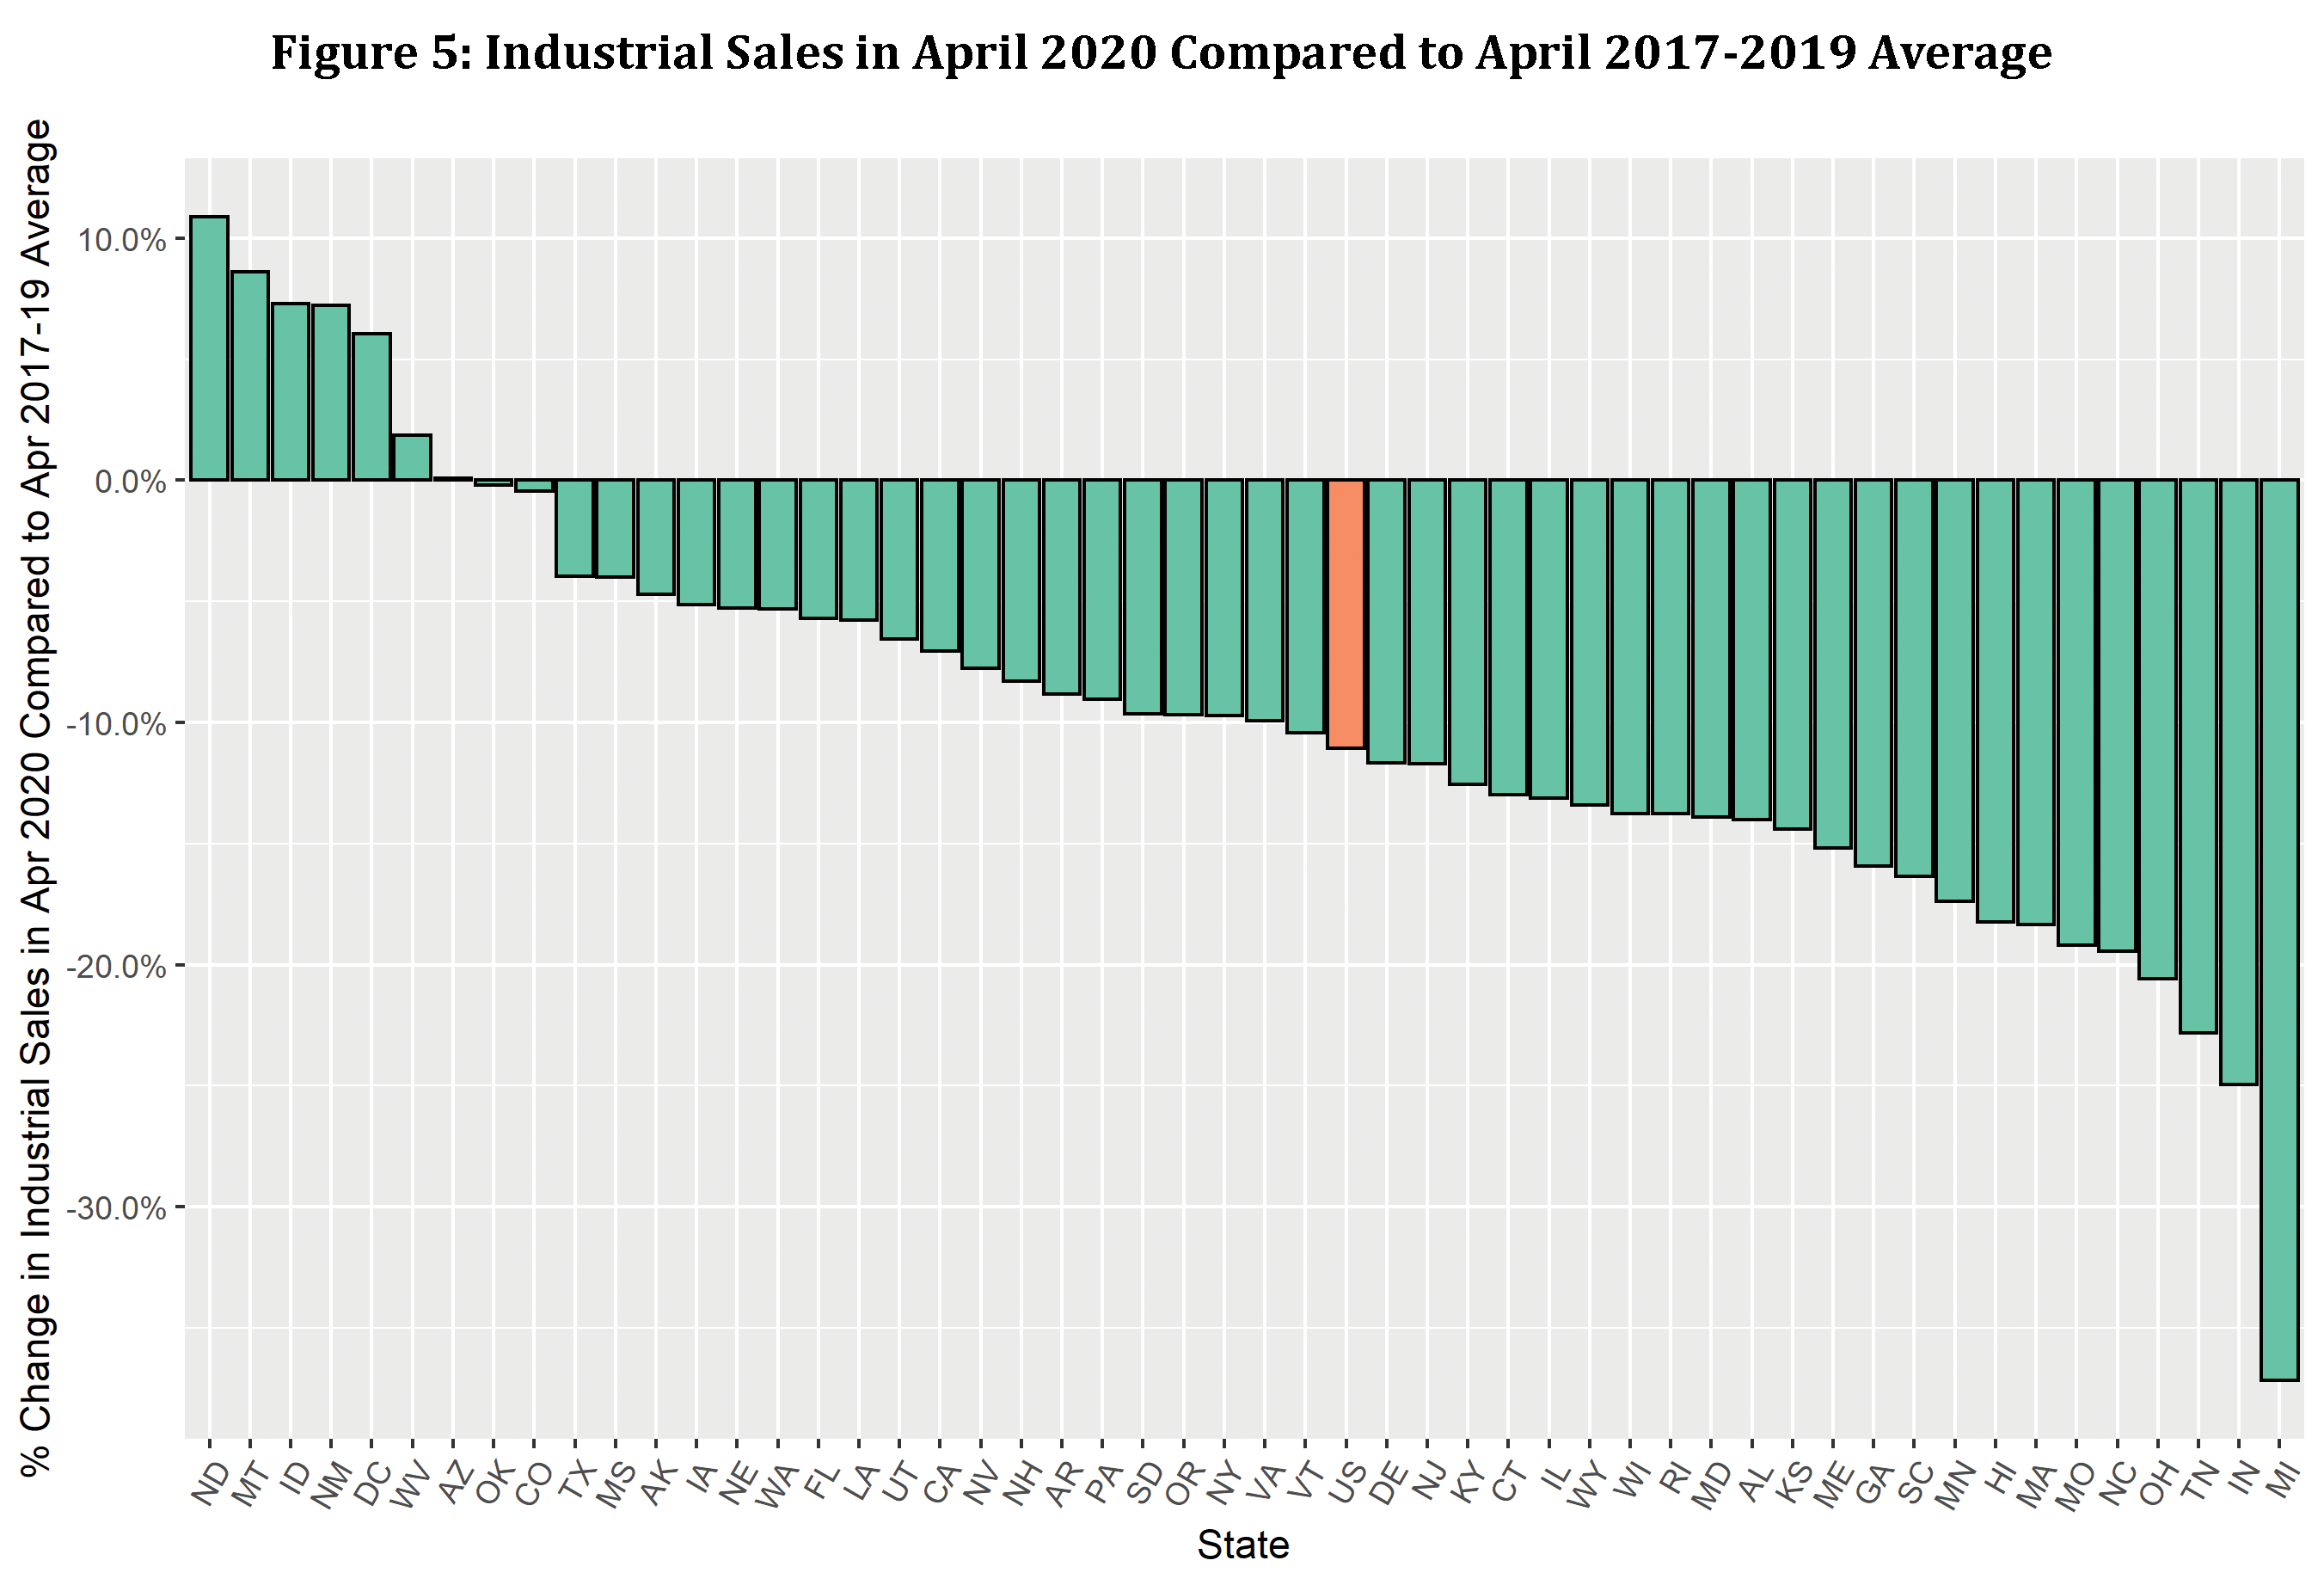
We can learn more by looking at sales patterns at a more granular level. We examined sales in April 2020 for each sector compared to the sales for the same month over the past five years at the state level. Generally speaking, the results were as expected for the commercial and industrial sectors. For most states, April 2020 had the lowest sales from commercial and industrial sectors when compared to the last five Aprils due to the slowdown caused by the pandemic. The April 2020 sales were 16% and 12% lower than April 2019 sales for the commercial and industrial sectors, respectively. The chart below shows commercial sales in each of the last four Aprils by state.

Utility Commercial Sales by State

April 2020 versus Average April 2017-2019

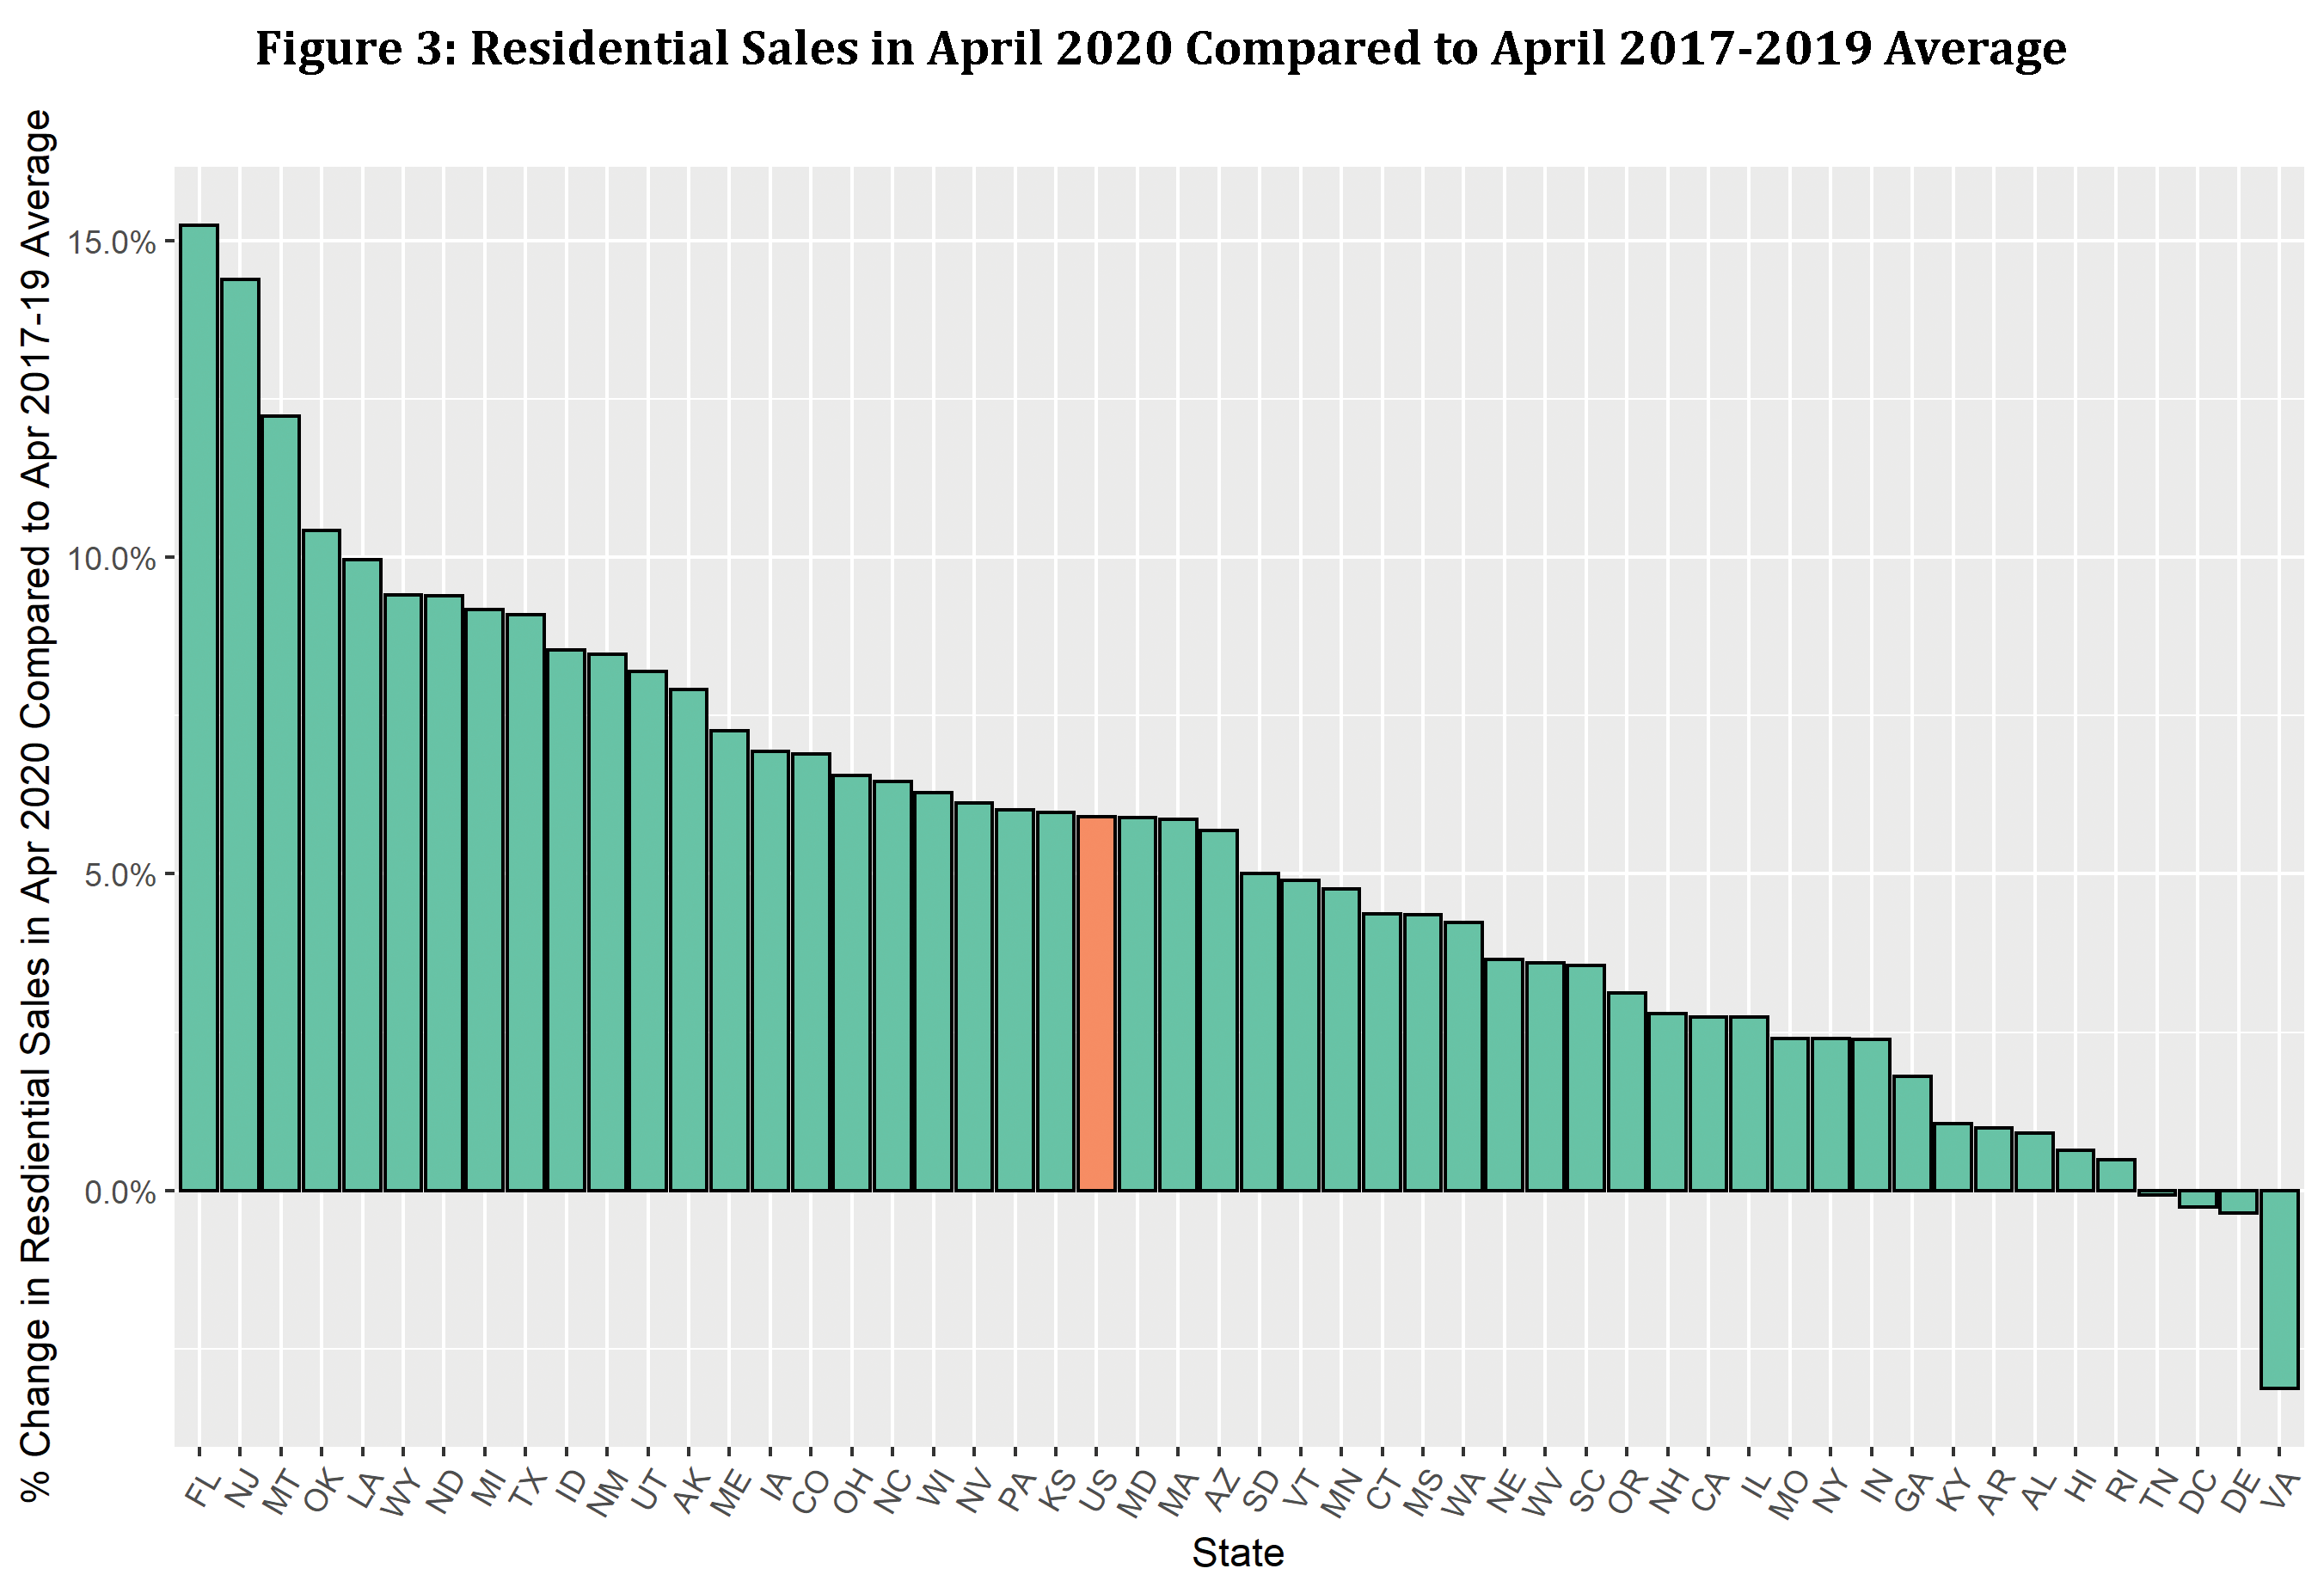
We wanted to analyze how April 2020 sales compared to the average April sales in the prior three years (i.e., 2017-2019) for each sector. As shown by the graphs below, April 2020 sales for the residential sector was higher than the April 2017-2019 average sales for all but four states. The percentage change in sales ranges from a high of approximately 15% to a low of roughly -3%.

April 2020 sales rates for the commercial and industrial sectors were lower than the April 2017-2019 average sales for all but one state for the commercial sector and all but seven states for the industrial sector.

Utility Residential Sales in April 2020

Utility Commercial Sales in April 2020

Utility Industrial Sales in April 2020

Revenue Impact of COVID-19

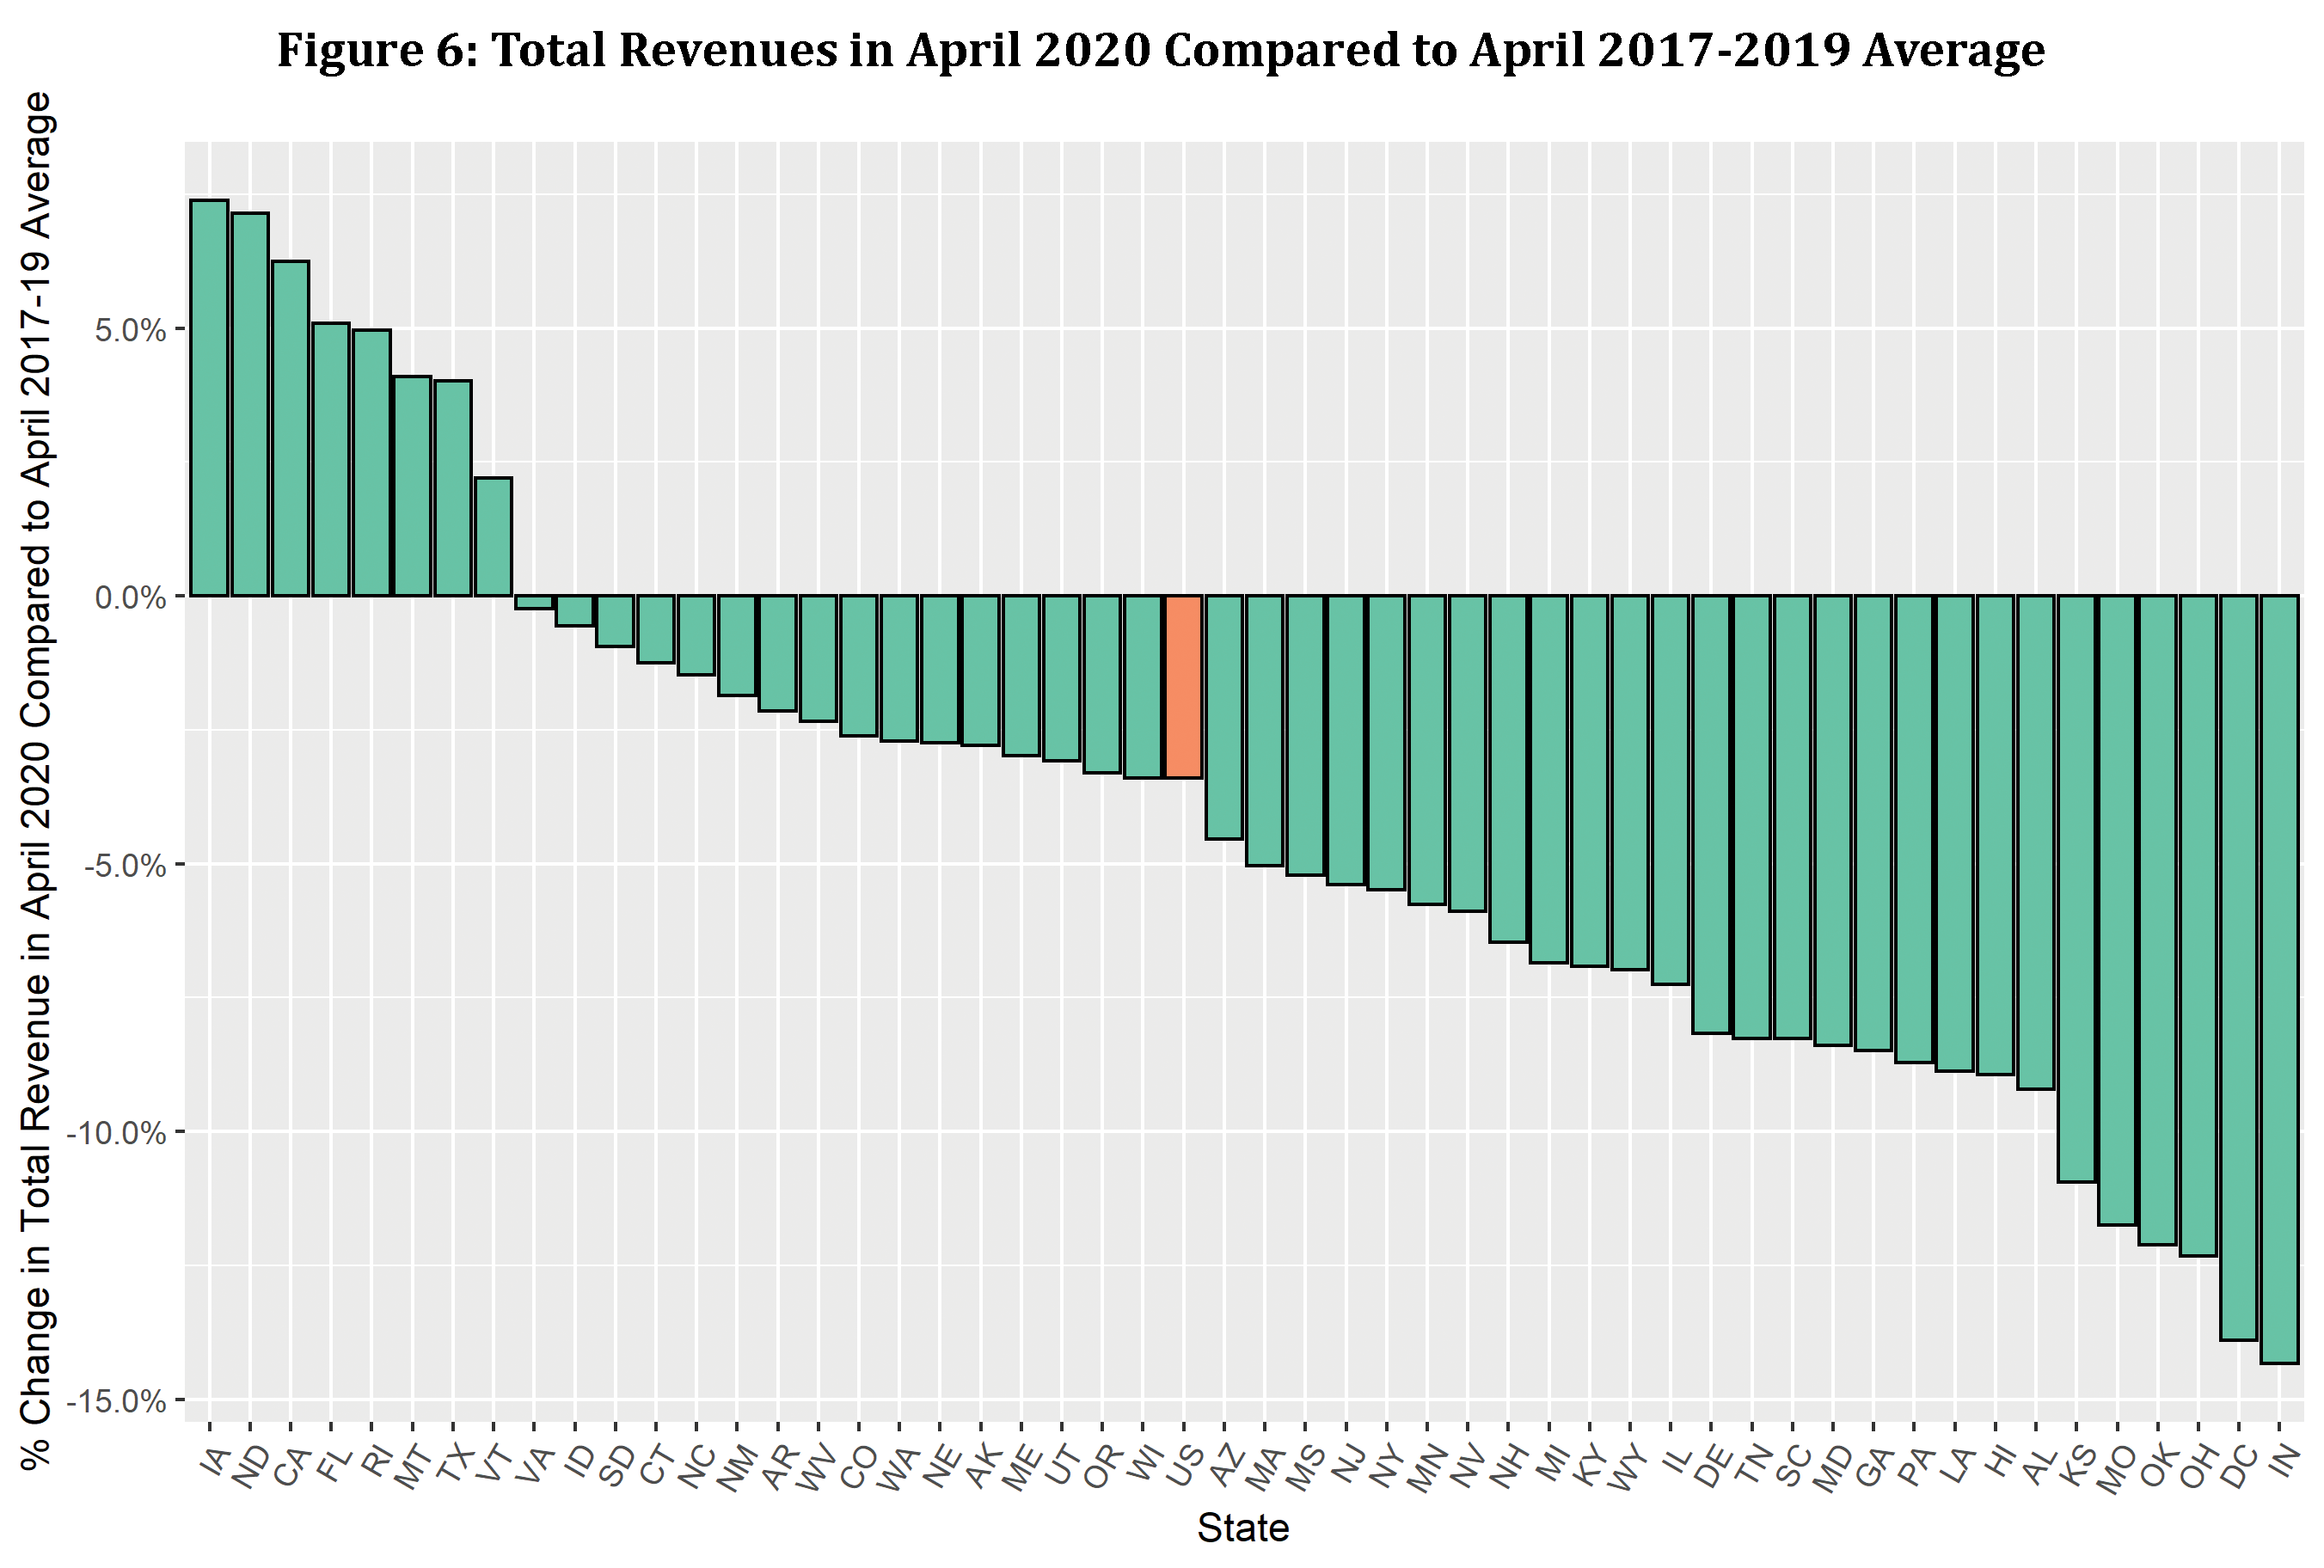
After establishing that residential sales had moved in the opposite direction to commercial and industrial sales, we analyzed the overall net impact on the revenues collected. We examined how much, if any, the loss in revenues from the commercial and industrial sectors would be offset by the increase in revenue from the residential sector. When we compared the change in total April 2020 revenues to the average April revenues in 2017-2019, the change in revenues followed a similar pattern as the change in total sales. It is important to note that non-payments may be driving a portion of the reduction in total revenue in April 2020 in addition to reduced load.

COVID Revenue Impact on Utilities

The critical question is: how will the change in load driven by the pandemic impact regulated utilities? The answer depends on each utility’s unique circumstances, some of which are listed below:

As next steps, we plan to analyze monthly data beyond April 2020 as it becomes available. The data for these later months, especially the summer months, will be crucial because those are the peak electricity sales months and peak revenue collection months. Drastic changes to sales during the summer months will have significantly more impact on revenues as compared to the months. Additionally, we also want to explore the various options available to utilities, regulators, and other stakeholders to address the COVID-19 related issues discussed herein.

More From Concentric:

COVID-19 Related Shutdowns Are Flattening the Curve of Electricity Demand: Experience in New York City

All views expressed by the author are solely the author’s current views and do not reflect the views of Concentric Energy Advisors, Inc., its affiliates, subsidiaries, or related companies. The author’s views are based upon information the author considers reliable. However, neither Concentric Energy Advisors, Inc., nor its affiliates, subsidiaries, and related companies warrant the information’s completeness or accuracy, and it should not be relied upon as such.

[1] Data was obtained from EIA using EIA’s API and the analysis was conducted in R, a free statistical software. The data used in this analysis is based on Form EIA-861M “Monthly Electric Power Industry Report”, which collects sales of electricity and associated revenue, each month, from a statistically chosen sample of electric utilities in the United States.

Are Demand Charges Appropriate for Sending Price Signals for Electric Distribution Systems?

Published on June 26, 2020 

By: Team Concentric

This article is the second in a series addressing the changing environment for regulated utility pricing given advances in Distributed Energy Resource technology, data availability, and customer preferences. Part One, Renewable Distributed Generation and Pricing Challenges, addressed the issue of Net Energy Metering.

Demand charges have been a component of electric utility pricing design for many decades. The original arguments for demand charges were developed by John Hopkinson[1] and further summarized by James Bonbright:

“The full rationale of this Hopkinson, two-part rate is far from simple. But the rationale usually given (although it will serve only as a first approximation) is that the two-part rate distinguishes between the two most important cost functions of an electric-utility system: between those costs that vary with changes in the system’s output of energy, and those costs that vary with plant capacity and hence with the maximum demands on the system (and subsystems) that the company must be prepared to meet in planning its construction program.”[2]

However, industry experts are now debating whether demand charges are an appropriate pricing mechanism, in particular for smaller customers (e.g., residential customers). Some compelling arguments against demand charges to consider:

·         Demand charges do not send proper price signals to customers.

·         Demand charges are expensive to implement.

·         Customers do not understand demand charges.

·         Customers cannot react and/or respond to demand charges.

·         No cost support exists for demand charges; they do not reflect the incremental cost to use the distribution system.

·         Distribution investments should be recovered by some form of energy charge.

In this article, we limit the debate to electric distribution systems. We will assess the arguments for and against demand charges and determine if demand charges are an appropriate mechanism in an electricity pricing design.

The Economics of an Electric Distribution System

One of the traditional arguments for the regulation of utilities is the existence of natural monopolies. A natural monopoly is defined as an industry with economies of scale, which results in the long-run marginal cost below the average cost for a single producer. Given the economies of scale associated with electric distribution systems, it is only economically efficient for a single system to exist within a given geographic area.

Unlike competitive markets, where prices are established at the marginal cost of production, a natural monopoly must set prices above the marginal cost. The revenues generated by marginal cost prices are insufficient to financially support the system. Therefore, the challenge for a natural monopoly is to determine how to recover the additional needed revenue in a manner that is considered equitable and sends a proper price signal to the customer.

In the energy industry, experts have argued that distribution systems are not constructed to serve demand and that their cost structure is fixed. To address such arguments, the authors consulted on the design of electric distribution systems with Anthony (Tony) Hurley. Mr. Hurley is an electric distribution system expert with over 30 years of experience. He is currently a Consultant at Critical Preparedness, LLC and previously held a leadership role in Electric Distribution at FirstEnergy as Vice President of Operations at Jersey Central Power & Light. Mr. Hurley stated:

Every customer on a distribution circuit, whether residential, commercial, or industrial, has a load profile that mirrors their load usage and peak demands, with the data being captured by the utility. From this demand information, distribution engineers are able to make investment decisions and reconfigure circuits if loads may exceed equipment ratings, and forecast the need for capital projects, including equipment upgrades and possibly new substations to address peak loads. To accept the premise that demand information is not used in Distribution Planning is incorrect.

Ultimately, the planning function for a distribution system is based upon expectations of demand growth within that system. For a system operator to send the correct price signal to customers, the distribution system should be priced at the long-run marginal cost.

Definition – What is Demand?

Traditional definitions of demand, (e.g., the maximum level of consumption by a customer averaged over a time period such as a one-hour or 15-minute interval), imply a one-way flow of power from the utility to the customer. However, the traditional definition of demand is no longer applicable in a world with Distributed Energy Resources (DER). The growth of DER means that a utility is now required to plan not only for an inflow of electricity to the customer, but an outflow from that same customer to the distribution system if their DER output exceeds consumption at a given point in time. A specific example of this is a customer with a small residential solar array who draws energy at night when the panels are not generating power, but during the day may produce more than they consume. Therefore, a pricing mechanism designed for demand could be characterized as an “option.” Customers would purchase an option designed to allow them to use a system up to a certain quantity of demand, either received or injected into the distribution system. This behavior would provide proper production signals to the utility, guiding better-informed investment.

Arguments Commonly Made Against Demand Charges

Argument 1: “Demand Charges Do Not Reflect the Incremental Cost of Using the Grid”

An argument is often made that demand charges do not reflect the incremental cost to serve customers, but instead are based upon average embedded costs. As a result, they would send a false price signal to customers. Some truth can be ascribed to this statement if the pricing design follows an embedded cost of service approach.

However, the development of long-run marginal cost of service is possible; such studies have been performed by many utilities in the last several decades. A traditional approach to developing demand charges based upon average embedded costs can be problematic. Still, recent innovations have included a more detailed analysis of the distribution cost structure and the impact of DER.

Argument 2: “Demand Meters are Expensive to Implement

To create and implement a demand charge, the customer premises must be outfitted with metering equipment, which is capable of measuring that customer’s demand in real-time. A traditional argument against implementing demand charges for residential and small commercial customers is that the incremental cost of this metering technology is expensive, and it is not cost-beneficial to install the metering technology on a system-wide basis.  Although this may have been true in the past, it is no longer accurate.

Metering technology costs have dropped dramatically in the last several decades.  The replacement of electromechanical technology with today’s Advanced Metering Infrastructure (AMI) equipment has reduced costs and increased reliability in many instances. Further, the cost of data management has decreased, allowing for more complex billing structures to be easily processed and delivered to customers. Modern metering equipment associated with AMI generally has the capabilities to provide revenue quality demand charges as well as other, more advanced pricing designs.

Argument 3: “Customers Do Not Understand Demand Charges”

Many parties have argued that customers, especially residential customers, are unable to understand the complexities of demand charges. They claim that traditional utility tariffs for smaller customers, based solely on two-part pricing designs (i.e., a fixed charge and an energy charge), remain appropriate.

We believe a discerning customer is able to navigate demand charges for the following reasons:

Underestimating the ability of customers to understand electric tariff designs is a mistake that simply reduces the number of service and pricing options available to residential customers. Given that such options are in many cases feasible, the result is fewer choices for residential customers, increased cross-subsidization, and potential increases in the utility revenue requirement, which could be avoided.

We agree that the introduction of new tariff designs, including demand charges, should include an education process for customers, but advanced pricing concepts should not be written off solely due to the perception that customers will not understand them.

Argument 4: Customers are Unable to React to Demand Charges

Some parties argue that customers cannot react to demand charges given the tariff design.  We reject this argument because:

Argument 5: Distribution Investments Should be Recovered by an Energy Charge

The last argument proposes to recover the costs of the distribution system through an energy charge.  Recovering distribution costs through an energy charge is deficient on several fronts and should be rejected for the following reasons:

 How Should the Non-Incremental Cost of the Distribution System be Recovered?

A question that has challenged the utility industry for many years is how to recover costs which exceed the long-run marginal costs to operate the distribution, or “Residual Costs.” That question will be addressed in the next paper in our series “The Application of Access Charges.”


For more information on the topics discussed in this article, please contact Tom O’Neill.


More From Concentric:

Renewable Distributed Generation and Pricing Challenges

All views expressed by the authors are solely the authors’ current views and do not reflect the views of Concentric Energy Advisors, Inc., its affiliates, subsidiaries, or related companies. The authors’ views are based upon information the authors consider reliable. However, neither Concentric Energy Advisors, Inc., nor its affiliates, subsidiaries, and related companies warrant the information’s completeness or accuracy, and it should not be relied upon as such.


[1] Hopkinson, John R., 1892. On the Cost of Electricity Supply, Transactions of the Junior Engineering Society. Vol. 3, No. 1, p1-14.

[2] “Principles of Public Utility Rates”, Public Utility reports, Inc. by James C. Bonbright. First edition 1961, page 310.

COVID-19 Related Shutdowns Are Flattening the Curve of Electricity Demand: Experience in New York City

Published on May 12, 2020

By: Marisa Ihara, Senior Project Manager

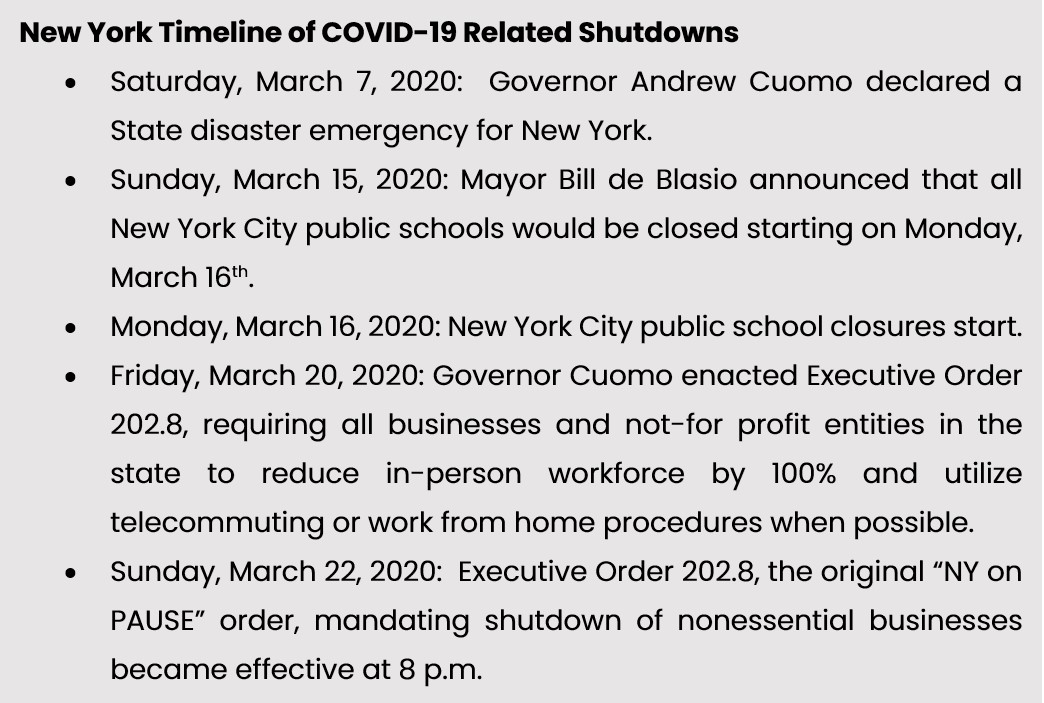
Starting on March 22, 2020, the State of New York closed all nonessential businesses to slow the spread of the virus that causes COVID-19. To investigate the effects of these shutdowns on electricity demand, Concentric Energy Advisors (“Concentric”) reviewed nine weeks of New York Independent System Operator (“NYISO”) hourly load data for March 1 through May 2, 2020, including the six weeks of full state shutdown spanning March 22 through May 2, 2020. The load data from this period of demand was compared to similar data from the prior three years, 2017, 2018 and 2019. Concentric analyzed load data for each of NYISO’s eleven zones separately, as load shifts and reductions associated with COVID-19 closures can be expected to vary depending on the proportion of commercial load in each region. In addition, we applied sequencing adjustments to the hourly load data for 2017, 2018 and 2019 to align their days of the week to the 2020 calendar.

The effects of COVID-19 related closures on electricity demand are most stark for New York City, the epicenter for the COVID-19 pandemic in the United States.

While our comparison does not adjust for weather differences or differences in customer-owned solar generation between prior years, New York City (NYISO Zone J) COVID-19 related load reduction trends are evident. The chart below compares real time hourly load data for March/April 2020 to the high/low intervals for the same period in the prior three years. In Week 1 (March 1 – 7), electrical loads appear near or below the prior three-year minimum. Noticeable load reduction/deviation from the prior three-year minimum is apparent starting in Week 3 (March 15 – March 21) commensurate with school closures. This increasing deviation from the prior year minimum becomes more prominent and consistent during the full shutdown starting on March 22 at the beginning of Week 4 (March 22 – March 28).

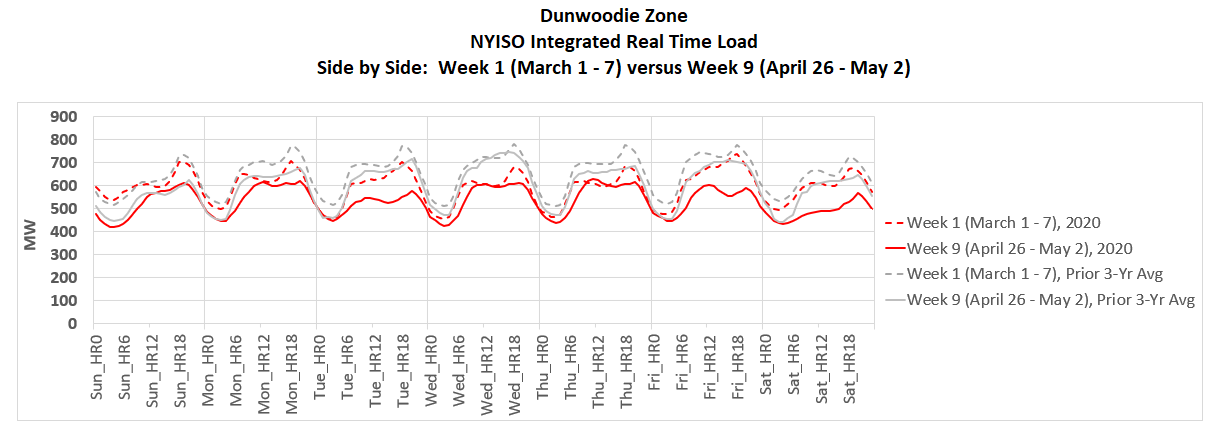
Under business-as-normal conditions, electrical load typically decreases from Week 1 (March 1 – March 7) to Week 9 (April 26 – May 2) with increasing spring temperatures and daylight hours, as shown by gray lines in the chart below, representing hourly average load for the prior three years. The decline in demand and energy consumption between Week 1 (March 1 – March 7) and Week 9 (April 26 – May 2) this spring is more pronounced than the average decline experienced in the prior three years. Maximum demand decreased from Week 1 (March 1 – March 7) to Week 9 (April 26 – May 2) by 20% in 2020 compared to an average reduction of 7% for the prior three years. Energy consumption decreased from Week 1 (March 1 – March 7) to Week 9 (April 26 – May 2) by 17% in 2020 compared to an average reduction of 9% for the prior three years.

To estimate 2020 Week 9 (April 26 – May 2) electrical loads that might have occurred under typical, business-as-normal conditions, Concentric applied the prior three-year average percentage reductions observed between Week 1 (March 1 – March 7) and Week 9 (April 26 – May 2) demand and energy to 2020 Week 1 (March 1 -March 7) observed demand and energy amounts, respectively.

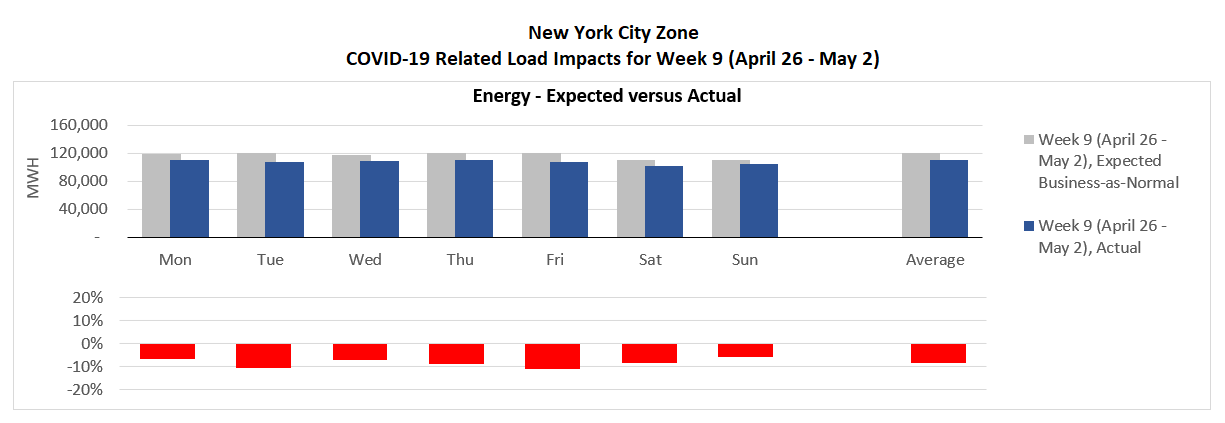
The charts below compare New York City demand and energy for each day in 2020 Week 9 (April 26 – May 2), the sixth week of the full shutdown, to expected demand and energy under business-as-normal conditions for the same period. The comparison of these two cases illustrates how electrical load for the New York City zone has both decreased and shifted as COVID-19 has forced businesses and schools to shut down, and many New York City residents have left the city. Maximum demand for Week 9 (April 26 – May 2) is down 14%, with demand reduction being greater for weekdays during daytime hours. Total energy for Week 9 (April 26 – May 2) is down 8% from expected consumption under business-as-normal conditions. Daily load profiles have flattened as nighttime load changes have been much smaller than those observed during daytime hours, and differentials between weekdays and weekends have diminished, providing quantitative support for why time under quarantine may feel like Groundhog Day.

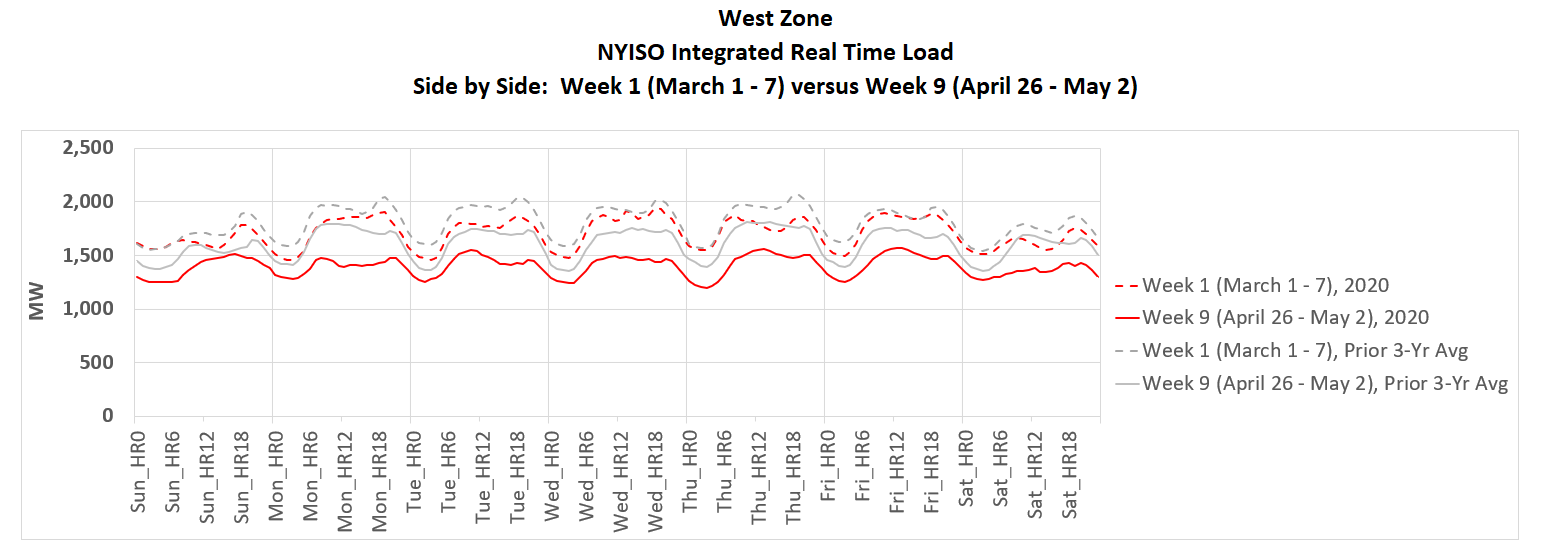
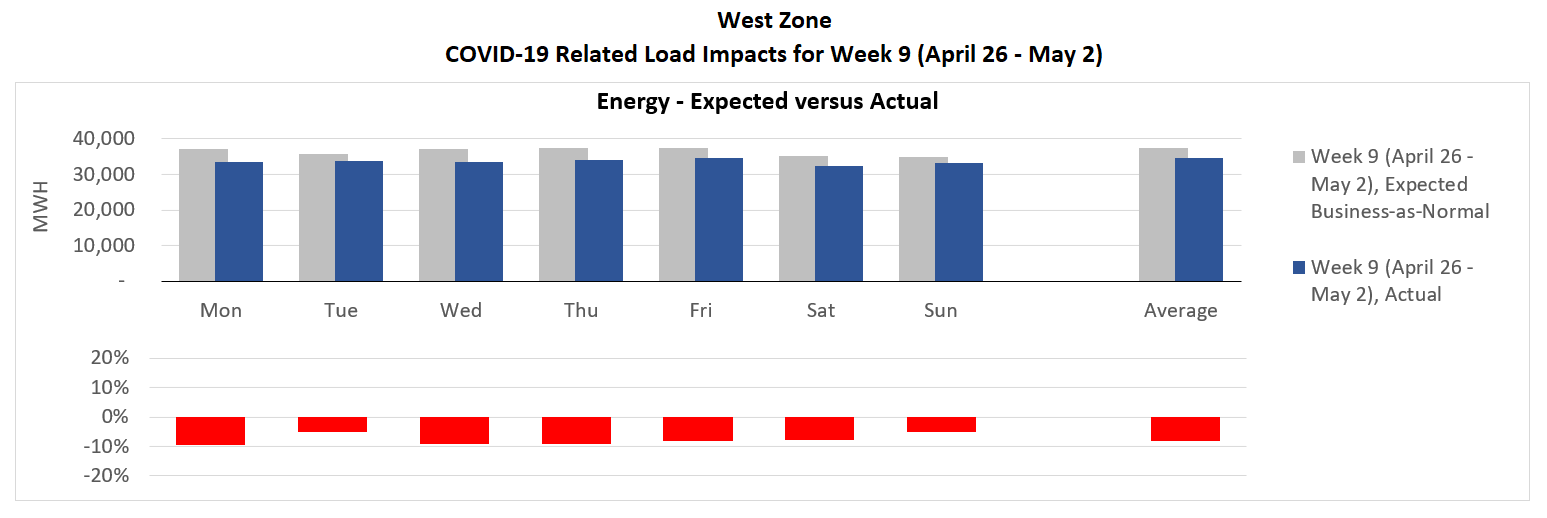
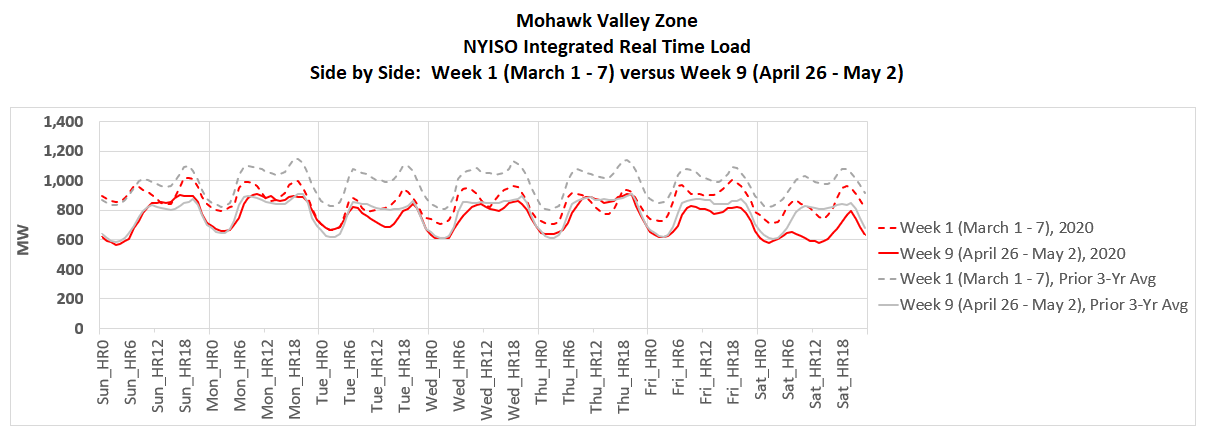
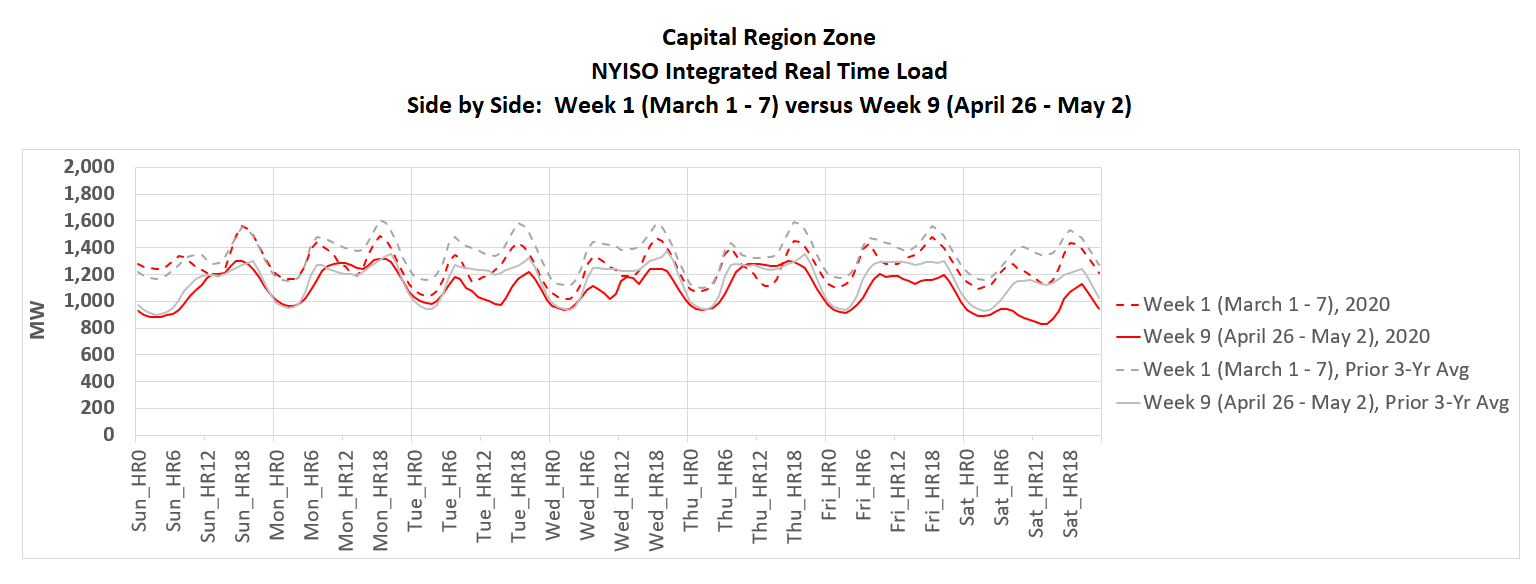
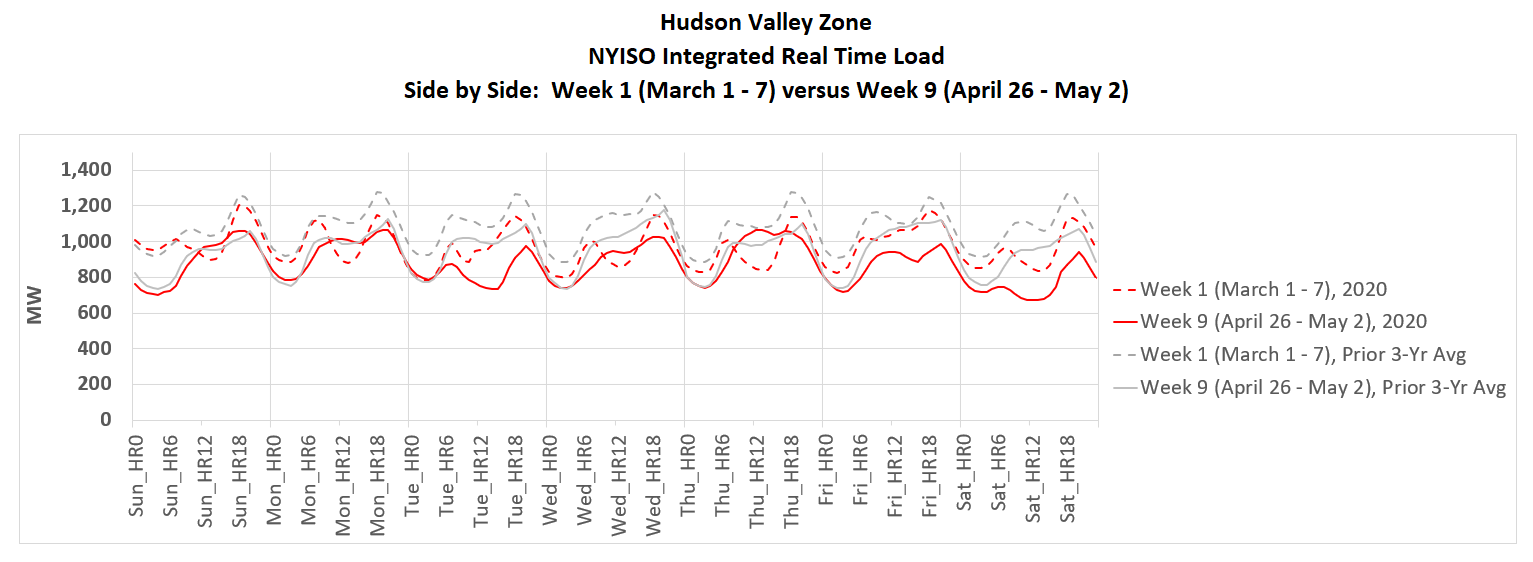
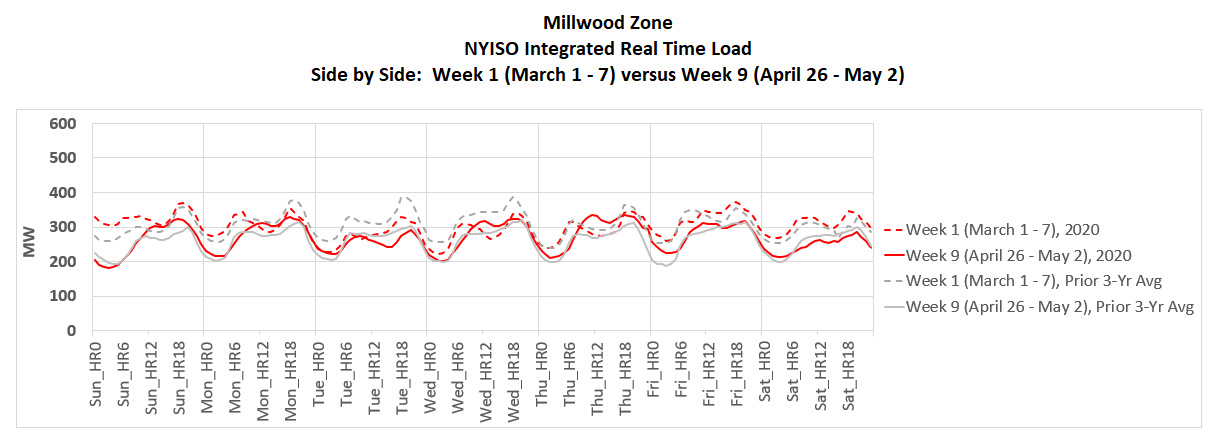
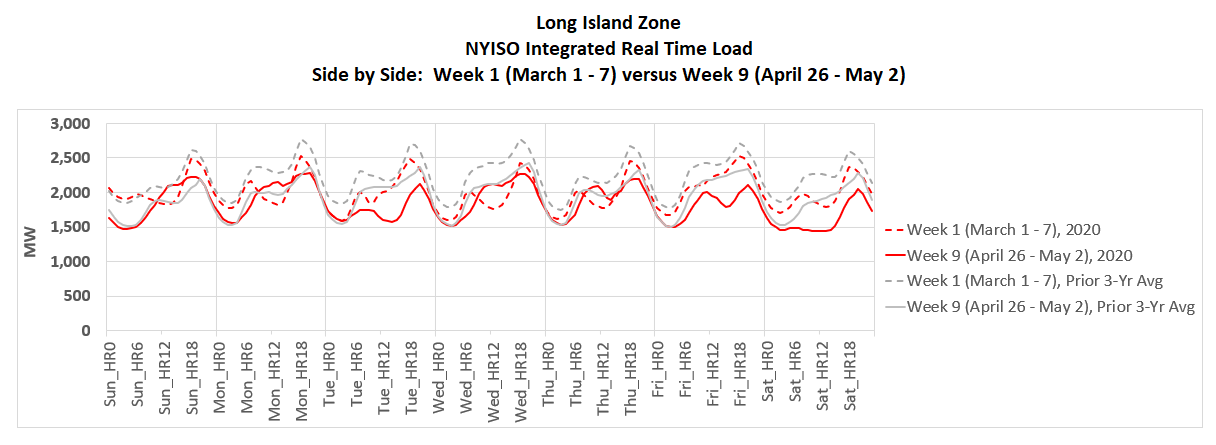
Demand and energy reductions have also been observed in Week 9 (April 26 – May 2) for the surrounding downstate Dunwoodie zone (Zone I), but not in Millwood (Zone H) or Long Island (Zone K). Demand and energy reductions have also been observed in Week 9 (April 26 – May 2) for the West zone (Zone A).

Week 9 (April 26 – May 2) demand and energy levels have not declined from expected levels under business-as-normal conditions and total energy consumption and maximum demand, to a lesser degree, may have increased in the Mohawk Valley (Zone E), Capital (Zone F), Hudson Valley (Zone G), Millwood (Zone H), and Long Island (Zone K). This suggests that reduced commercial load from COVID-19 related shutdowns is being countered by an increased residential load in suburban locations driven by changes in behavior under quarantine, such as purchasing of second freezers to store more food between less frequent grocery shopping, working from home, home schooling, increased stay-at-home activities that are energy intensive, like bread baking or growing seedlings indoors.

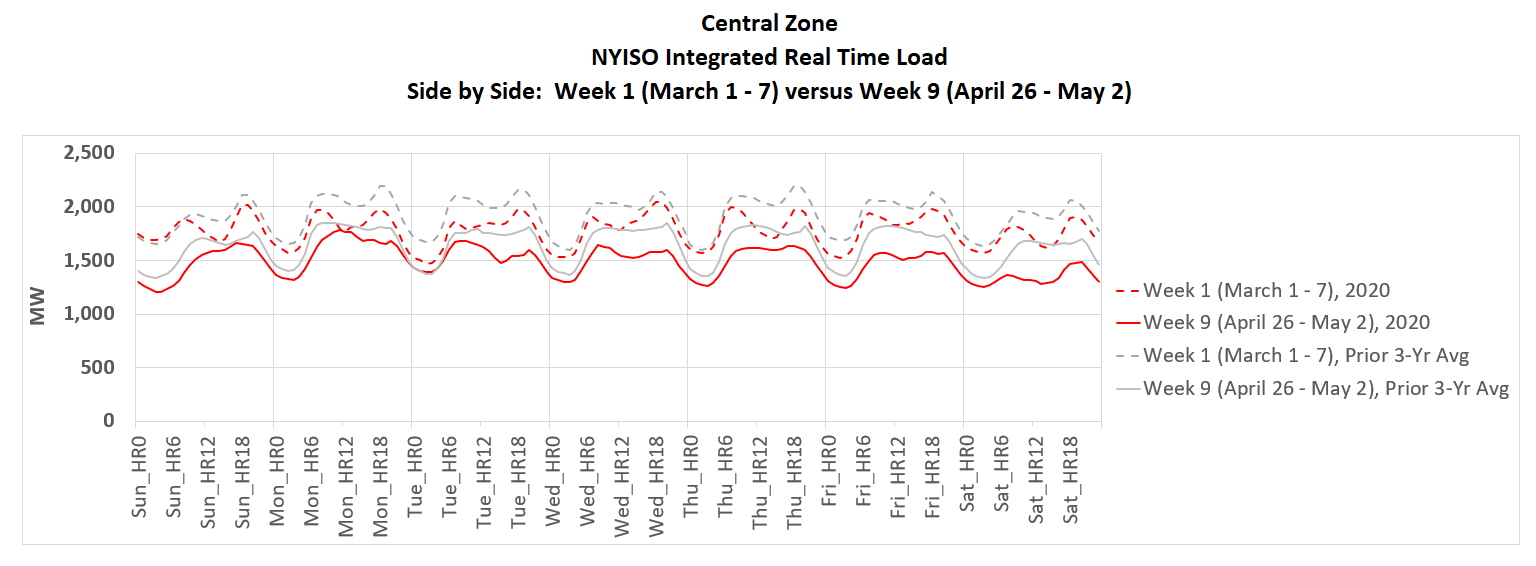
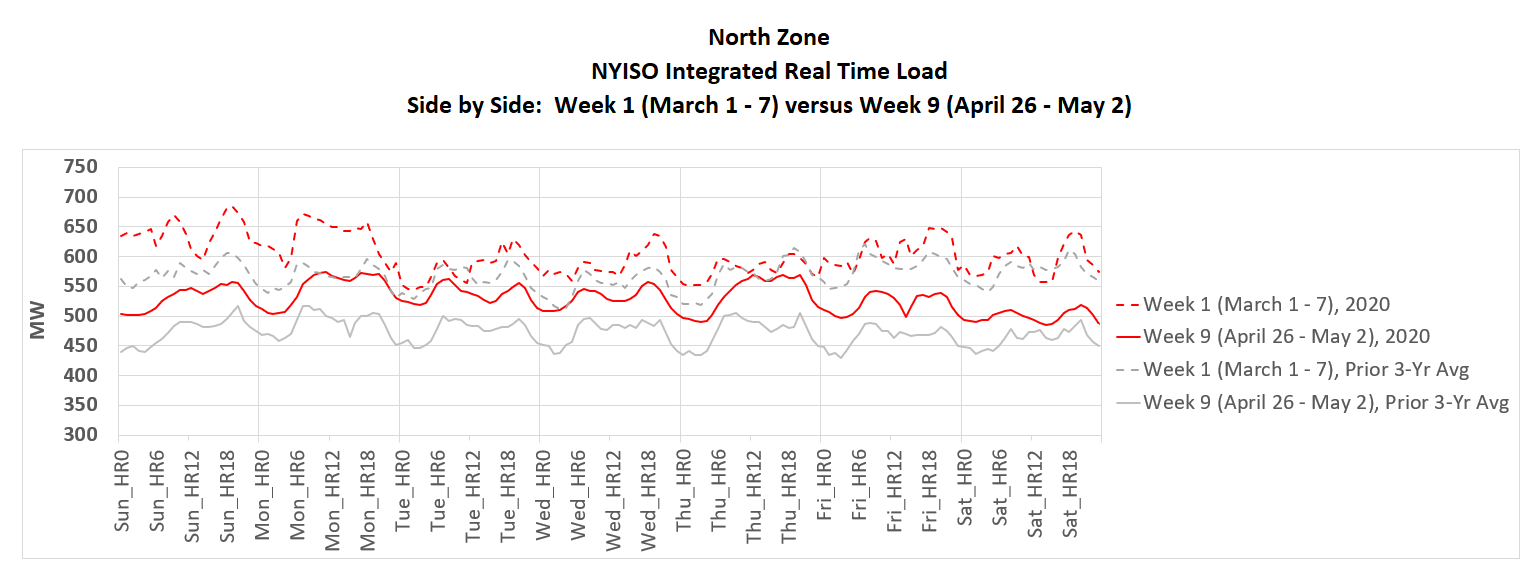
One common observable trend is that load is shifting away from Friday and Saturday to other days of the week. The severe reduction in Saturday morning load is particularly interesting, suggesting that people are tending to sleep in later on Saturdays or occupying their Saturday mornings with activities that require minimum power consumption.

While almost no change in Week 9 (April 26 – May 2) demand and energy levels have been observed in Genesee (Zone B), Central (Zone C), and North (Zone D) from expected levels under business-as-normal conditions, the load is still shown shifting away from Friday and Saturday mornings to other days of the week.

Concentric will continue to monitor NYISO load data trends during these unprecedented times as New York State moves towards summer months and partial re-openings of nonessential businesses, which could start after May 15, 2020 for certain upstate regions that meet required benchmarks, if the “NY on PAUSE” Executive Order 202.8 is not further extended. Schools and colleges in the state of New York will remain closed for the remainder of the academic year and will continue with distance learning to slow the spread of the virus that causes COVID-19.

More from Concentric:

COVID Impacts Depend on Sales Trends and State Ratemaking Policies

All views expressed by the author are solely the author’s current views and do not reflect the views of Concentric Energy Advisors, Inc., its affiliates, subsidiaries, or related companies. The author’s views are based upon information the author considers reliable. However, neither Concentric Energy Advisors, Inc., nor its affiliates, subsidiaries, and related companies warrant the information’s completeness or accuracy, and it should not be relied upon as such.


Newsletter Sign Up
 
Search
 
Follow