Opportunities for Nuclear Decommissioning Trust Funds and Other Long-Term Investments: Qualified Opportunity Fund Investments

Published on October 22, 2020

By: Lisa Quilici, Senior Vice President, and Daniel Dane, Senior Vice President

U.S. nuclear plant licensees are required to provide financial assurance for Nuclear Regulatory Commission (NRC) Radiological Decommissioning while a facility is operating. Nuclear Decommissioning Trusts (NDTs), which for an investor-owned utility are funded through rates and invested for future decommissioning, are the most common method of satisfying this requirement.[1] NDTs have very long investment horizons, and trust managers generally employ a portfolio approach to investing these funds. Given the long-term holding period of NDTs, Qualified Opportunity Fund investments offer NDT managers an investment vehicle with potential tax advantages. Given the potential for increases in taxes, these advantages are particularly compelling for investors able to benefit from them in 2020.

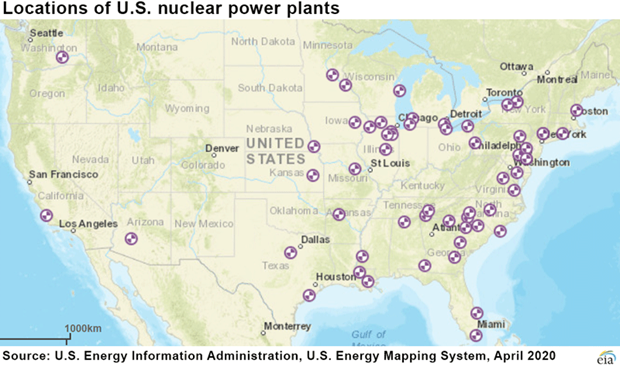
Map of nuclear reactor locations in the United States

The median NRC license life of the nation’s 95 operating nuclear reactors is approximately 18 years. Subsequent License Renewals (SLRs) are granted by the NRC and allow reactors to operate an additional 20 years beyond their license lives. Four reactors, Turkey Point Units 2 and 3 and Peach Bottom Units 2 and 3, have received SLRs.[2]  Investment horizons for these reactors extend to 2055.

Qualified Opportunity Zone Investments

The Tax Cuts and Jobs Act of 2017 created the Opportunity Zones tax incentive to spur economic development and job creation in distressed communities.  8,764 communities have received certification as Qualified Opportunity Zones (QOZs).

QOZs provide potentially substantial tax benefits to investors who re-invest long-term capital gains into a Qualified Opportunity Fund (QOF).[3] Investors in a QOF may benefit from:

For more information on NDTs and related QOF investment opportunities, please contact Daniel Dane, Senior Vice President, CE Capital Advisors, (617) 515-3739, ddane@ceadvisors.com and Lisa Quilici, Senior Vice President, Concentric Energy Advisors, (617)872-0248, lquilici@ceadvisors.com.

More from Concentric:

Is there a Silver Lining in Nuclear Decommissioning?

All views expressed by the authors are solely the authors’ current views and do not reflect the views of Concentric Energy Advisors, Inc., its affiliates, subsidiaries, or related companies. The authors’ views are based upon information the authors consider reliable. However, neither Concentric Energy Advisors, Inc., nor its affiliates, subsidiaries, and related companies warrant the information’s completeness or accuracy, and it should not be relied upon as such.

[1] See 10 C.F.R. § 50.75. See also 10 C.F.R. § 50.82 for regulations regarding the decommissioning process and use of decommissioning funds.

[2] https://www.nrc.gov/reactors/operating/licensing/renewal/subsequent-license-renewal.html

[3] https://www.irs.gov/newsroom/opportunity-zones

Pipe Replacement for a Decarbonized Future

Published on August 19, 2020

By: Alexander Cochis, Project Manager and Javier Sola, Consultant

Environmental advocates are challenging whether it makes sense to continue with existing pipe replacement programs, arguing that the industry is investing in rate base that will be stranded long before it is fully depreciated.

Key Considerations

A pipe replacement framework that incorporates uncertainty attributable to:

Will meet the challenges of a changing environment.

A New Investment Framework

The existing pipe replacement decision-making process focuses on how fast LDCs can replace at-risk pipe and how best to prioritize and execute their pipe replacement programs. These decisions are driven by federal mandates and subject to oversight by state utility regulators that are concerned about safety and cost. Environmental advocates are opposing new pipelines but also suggesting that LDCs should be at risk for future pipe replacement investments, as they increasingly focus on gas planning processes and decisions. Regulators recognize that pipeline safety is paramount. How can LDCs adjust the decision-making framework to support pipe replacement decisions? Our current assessment is that the degree of policy change, technological advances, and the costs of alternatives or substitutes to natural gas all play a role in framing a response to the challenges of decarbonization on pipe investment decisions.

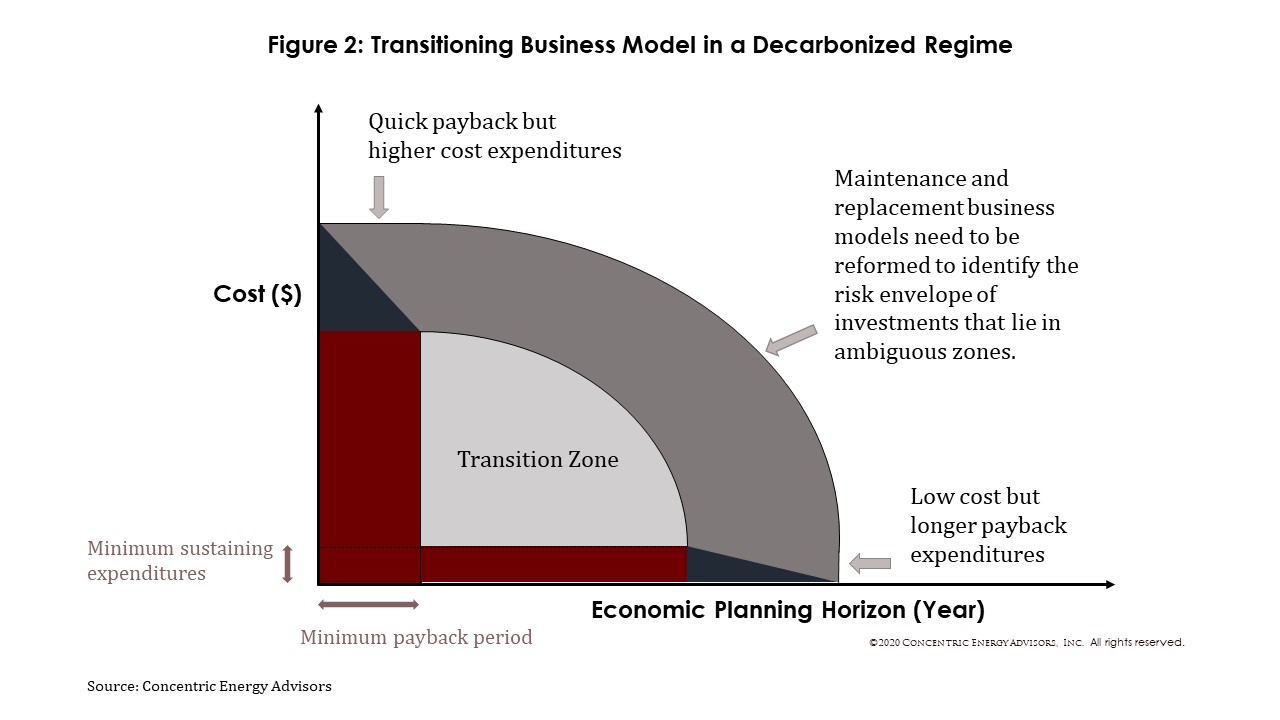
For a gas company to fulfill its public service mandate, it will make ongoing maintenance, monitoring, and operating expenditures to sustain the system and comply with safe operating practices (Figure 1). The LDC can also make investments to grow. As costs increase, operators will decide how long before those outlays are completely recovered.The Pipe Replacement Decision Framework in Figure 2 depicts areas that represent varying degrees of costs, recovery time, and risk for the project types in Figure 1.

Project types in the Pipe Replacement Decision Framework present risks that are the product of both the likelihood of being unable to sufficiently recover capital and the amount of capital exposed. The further investment decisions move away from the short payback and minimum expenditure programs, the closer decisions are framed by a “risk envelope” space depicted in the Framework. Trade-offs may begin to appear between lower cost pipe segments that have longer time horizons to recover capital (new branch lines with few customers) and larger capital investments with shorter paybacks (removal and replacements of entire mains in established and densely served areas). As undepreciated investments approach economic planning horizons or any other mandated useful lives, the potential for customer rate shock as obsolete capital is recovered or loss to shareholders from stranded cost presents an opportunity to look for innovative capital investment and recovery methods.

Decarbonization policies are likely to change the risk analysis. Environmental considerations may accelerate technological improvements toward lower carbon natural gas through targeted investments and state or provincial carbon intensity limits. While mandates and subsidies are by their nature distortive, they can also spur new delivery models. Power supply renewables, for example, are following a discernible cost decline as mandated investments lead to economies of scale.

Risk introduces elements of time-sensitive paybacks to traditional decision-making metrics like net present value, rates of return, and size of rate base. This may present more realistic prospects for pipe recovery for a gas company facing more ambitious decarbonization policies. The new investment decision framework should incorporate uncertainty. Decarbonization policy, the economics of electrification, customers’ preference to continue to use natural gas, and new safety protocols all change the investment views on how long new pipe will be needed.

Responses to Some Common Questions

Should the LDC continue, accelerate, or reprioritize its pipe replacement program?

Under the Pipe Replacement Decision Framework, the degree of decarbonization will be a significant driver of the answer to this question, with “net zero carbon” scenarios presenting the greatest risk, as will the timeline for phasing in the program. Pipe system integrity is regulated by the states, and federally by the Pipeline and Hazardous Materials Safety Administration (PHMSA) under the Distribution Integrity Management Program (DIMP). Given the duty to maintain a safe system, any decarbonization policy would need to support system safety to the extent the system or certain segments or subsystems remain in service. While an argument might be made for repairing, rather than replacing, the classes of leak-prone pipe (LPP) currently targeted under DIMPs, the trade-off would require careful risk analysis of the LPP in order to ensure that leaks are maintained on the system at a manageable level. Pipe replacement is usually triggered by integrity concerns or capacity needs. These investment decisions could be broadened to reflect decarbonization policies. Depending on the type of decarbonization policy adopted by the state, pipe programs may be reconfigured to include the consideration of the use of new technologies, including, for example, the use of geothermal district heating as an alternative to replacement of LPP lines.

If regulators place shareholders at risk for new pipe by ruling against stranded cost recovery, how can local LDCs manage that risk? 

A significant driver of the answer to this question will depend on the carbon scenarios mandated. Investment strategy will reflect the level of increased risk and the pace of decarbonization. Asset management and portfolios, market position, and performance metrics will shift in the LDC company space. Pipe investment moves from a series of cost of service approval exercises to a dynamic consideration of available alternatives, where market forces truncate useful lives, and the probabilities change once large investments are made.

For example, changes in public policy resulting in stranded costs would raise the business risk of the company and likely merit a higher allowed return. The degree of the decarbonization under new mandates would drive whether system investment strategy would change. To the extent that gas will still be needed for generation to balance higher levels of renewables that support decarbonization, for example, investment decisions may shift to supporting new generation rather than expanding residential service. If the decarbonization policy allows offsets, then investments could be made to support the offsets (e.g., reforestation programs) to maintain a status quo business plan in regulated operations. Should renewable natural gas (RNG) be available and competitive at scale and fall within the decarbonization policies, then a company could make investments to transition to RNG supplies.

Should the company propose a change to depreciation rates for existing or new pipe? 

Near-term increases in depreciation rates present ways to balance investment recovery with policy goals in an incremental manner and can be adjusted through a rate case, with due consideration to rate impacts. Future earnings levels could be relatively lower if decarbonization policy reduces rate base. For this reason, any change to depreciation or capital recovery must be made in concert with other variables such as rates of return, salvage costs, capital budgeting, or risk management. Higher depreciation rates would present a way to hedge some of the risk associated with the underutilization or early retirement of pipe. Should the type of decarbonization policy adopted lead to an early abandonment of pipe, then increasing the rate of depreciation would allow for the accelerated recovery of the investment, mitigating the risk of stranded assets.

All views expressed by the authors are solely the authors’ current views and do not reflect the views of Concentric Energy Advisors, Inc., its affiliates, subsidiaries, or related companies. The authors’ views are based upon information the authors consider reliable. However, neither Concentric Energy Advisors, Inc., nor its affiliates, subsidiaries, and related companies warrant the information’s completeness or accuracy, and it should not be relied upon as such.

COVID Impacts Depend on Sales Trends and State Ratemaking Policies

Published on August 6, 2020

By: Bickey Rimal, Assistant Vice President

The most recent electricity consumption data from the U.S. Energy Information Administration (“EIA”) reveals that the COVID-19 pandemic is significantly impacting electric utilities throughout the country. A continuing decline in sales during the peak summer period coupled with misaligned rate design and structures does not bode well for the utilities. The most adversely impacted utilities are those that:

U.S. Electricity Sales Since COVID-19

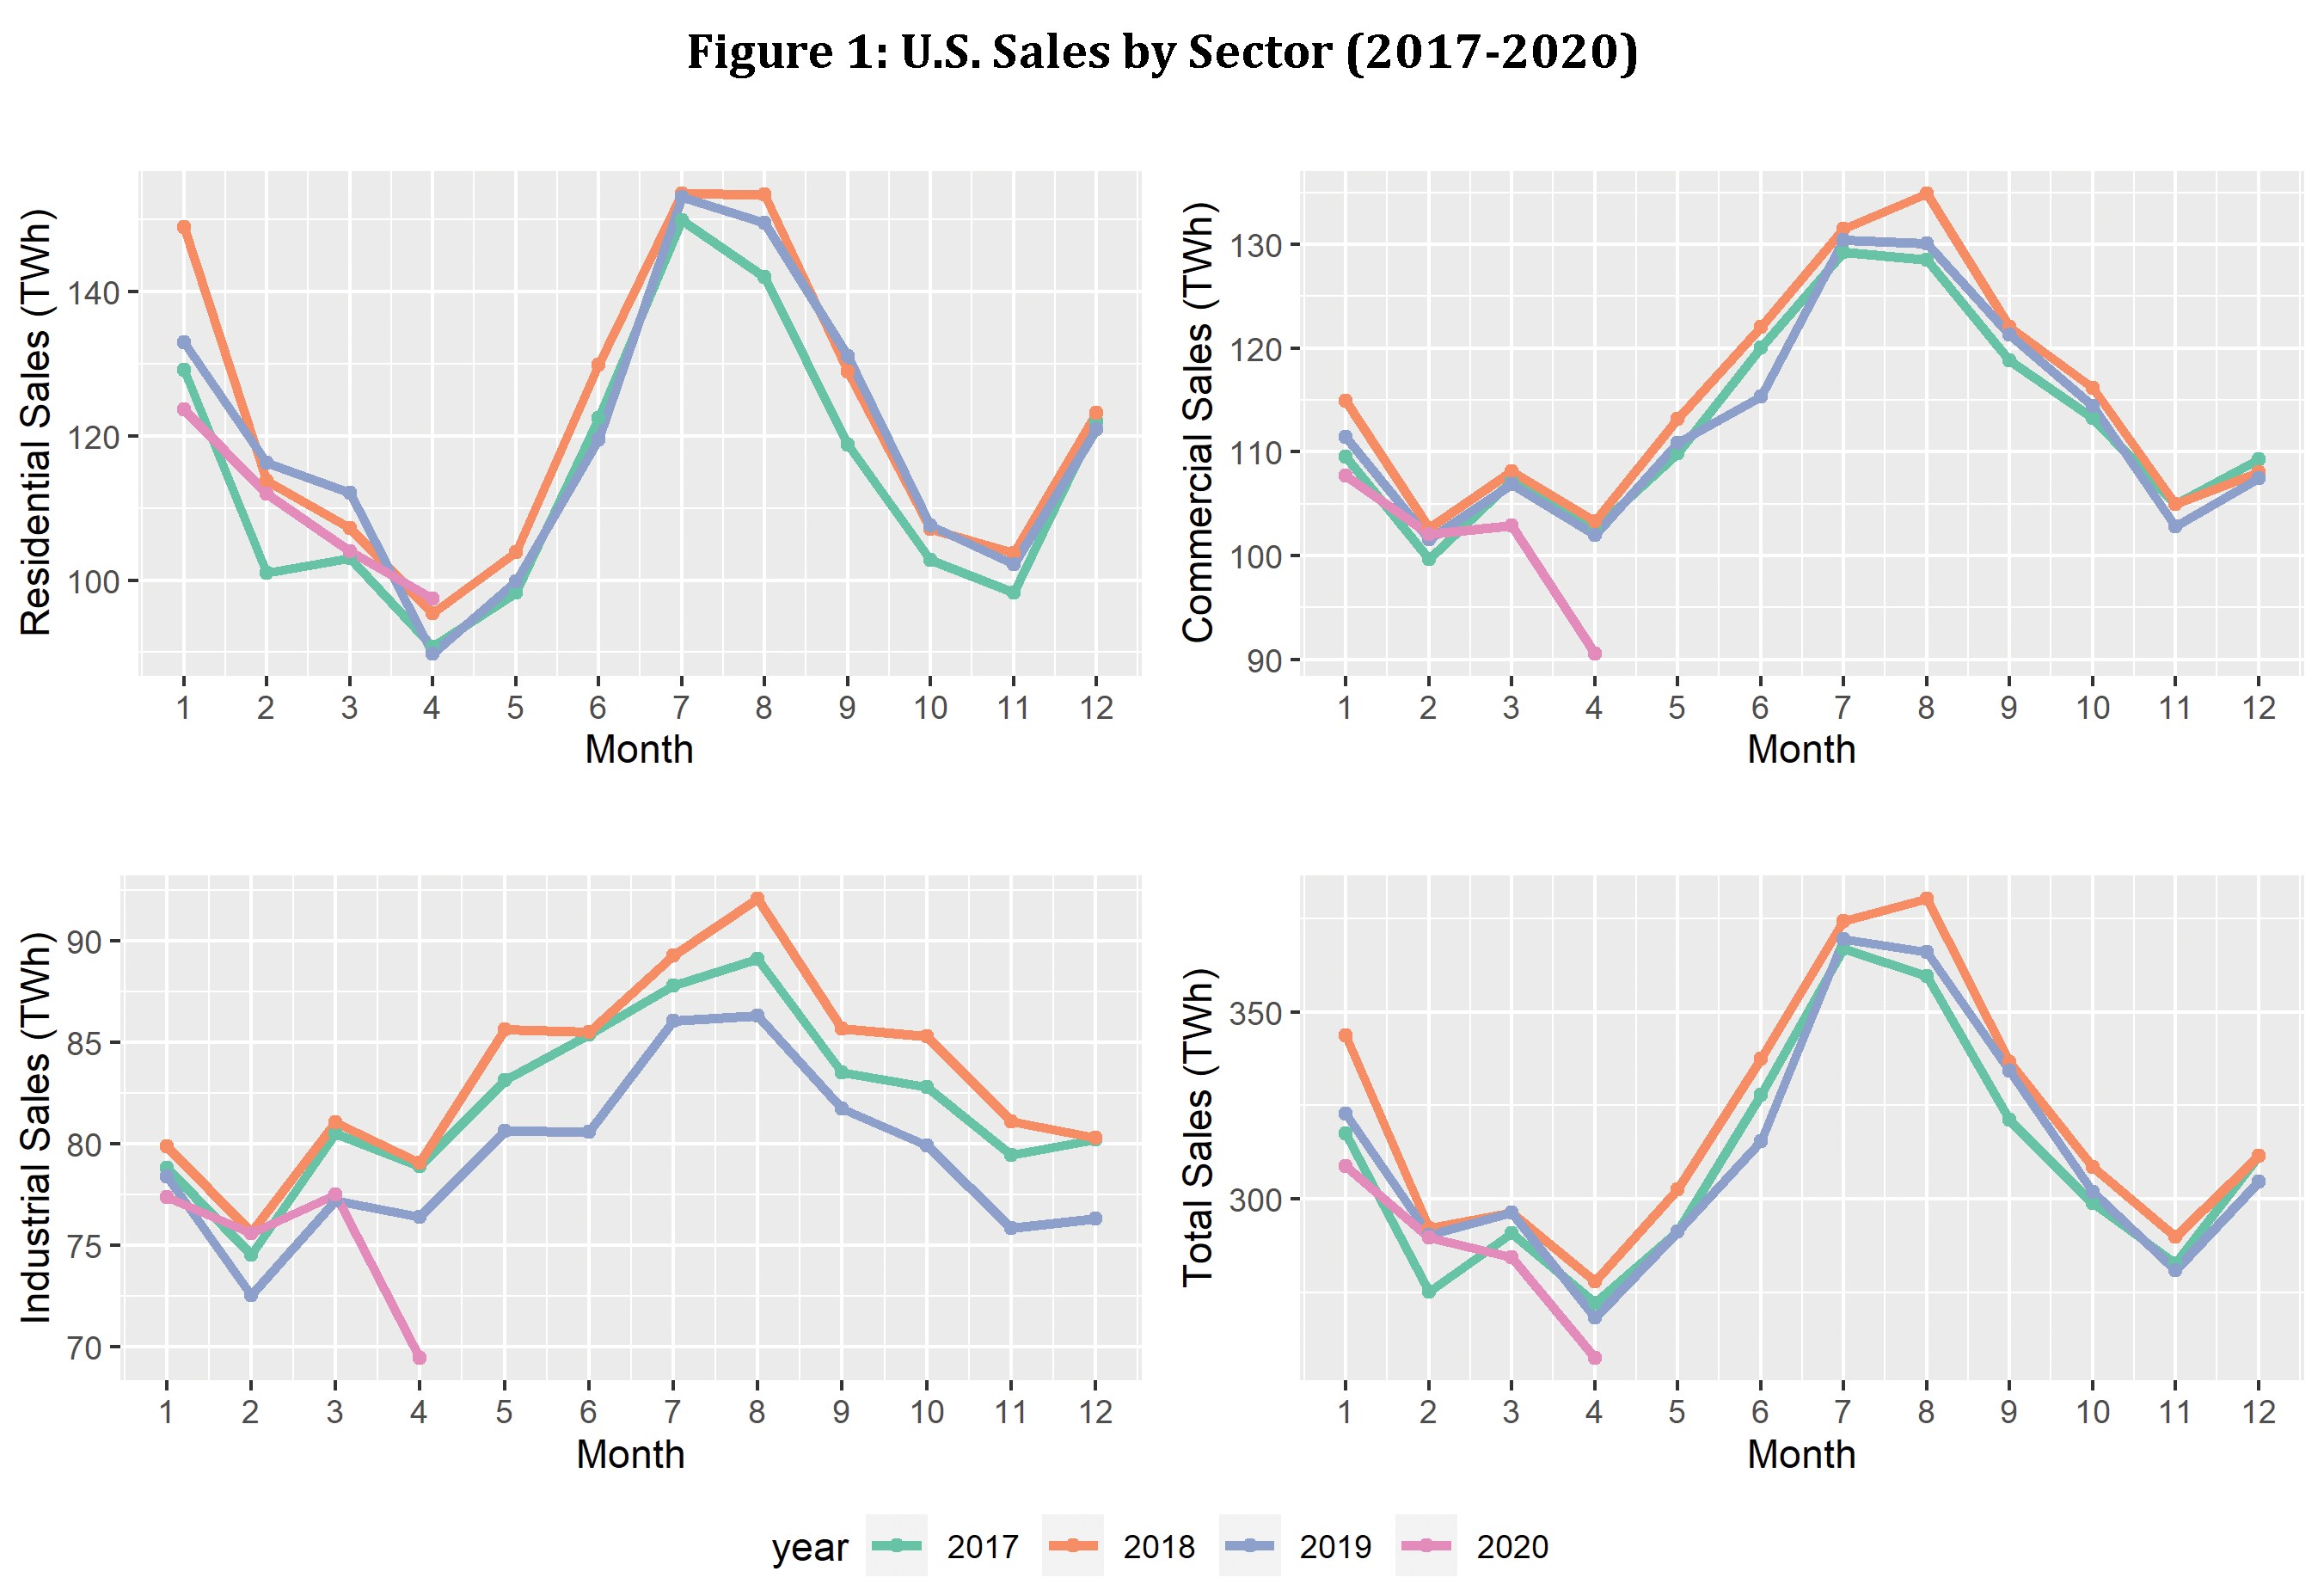
Based on the most recent monthly data published by EIA, total electricity sales in April of 2020 was the lowest level experienced since 2003, despite the fact that residential sales were their highest levels since 2001. [1] Commercial and industrial sectors experienced their lowest April sales since 2003. The following graph shows the monthly sales by sector over the last few years.

U.S. Utility Sales by Sector

State-Specific Sales Since COVID-19

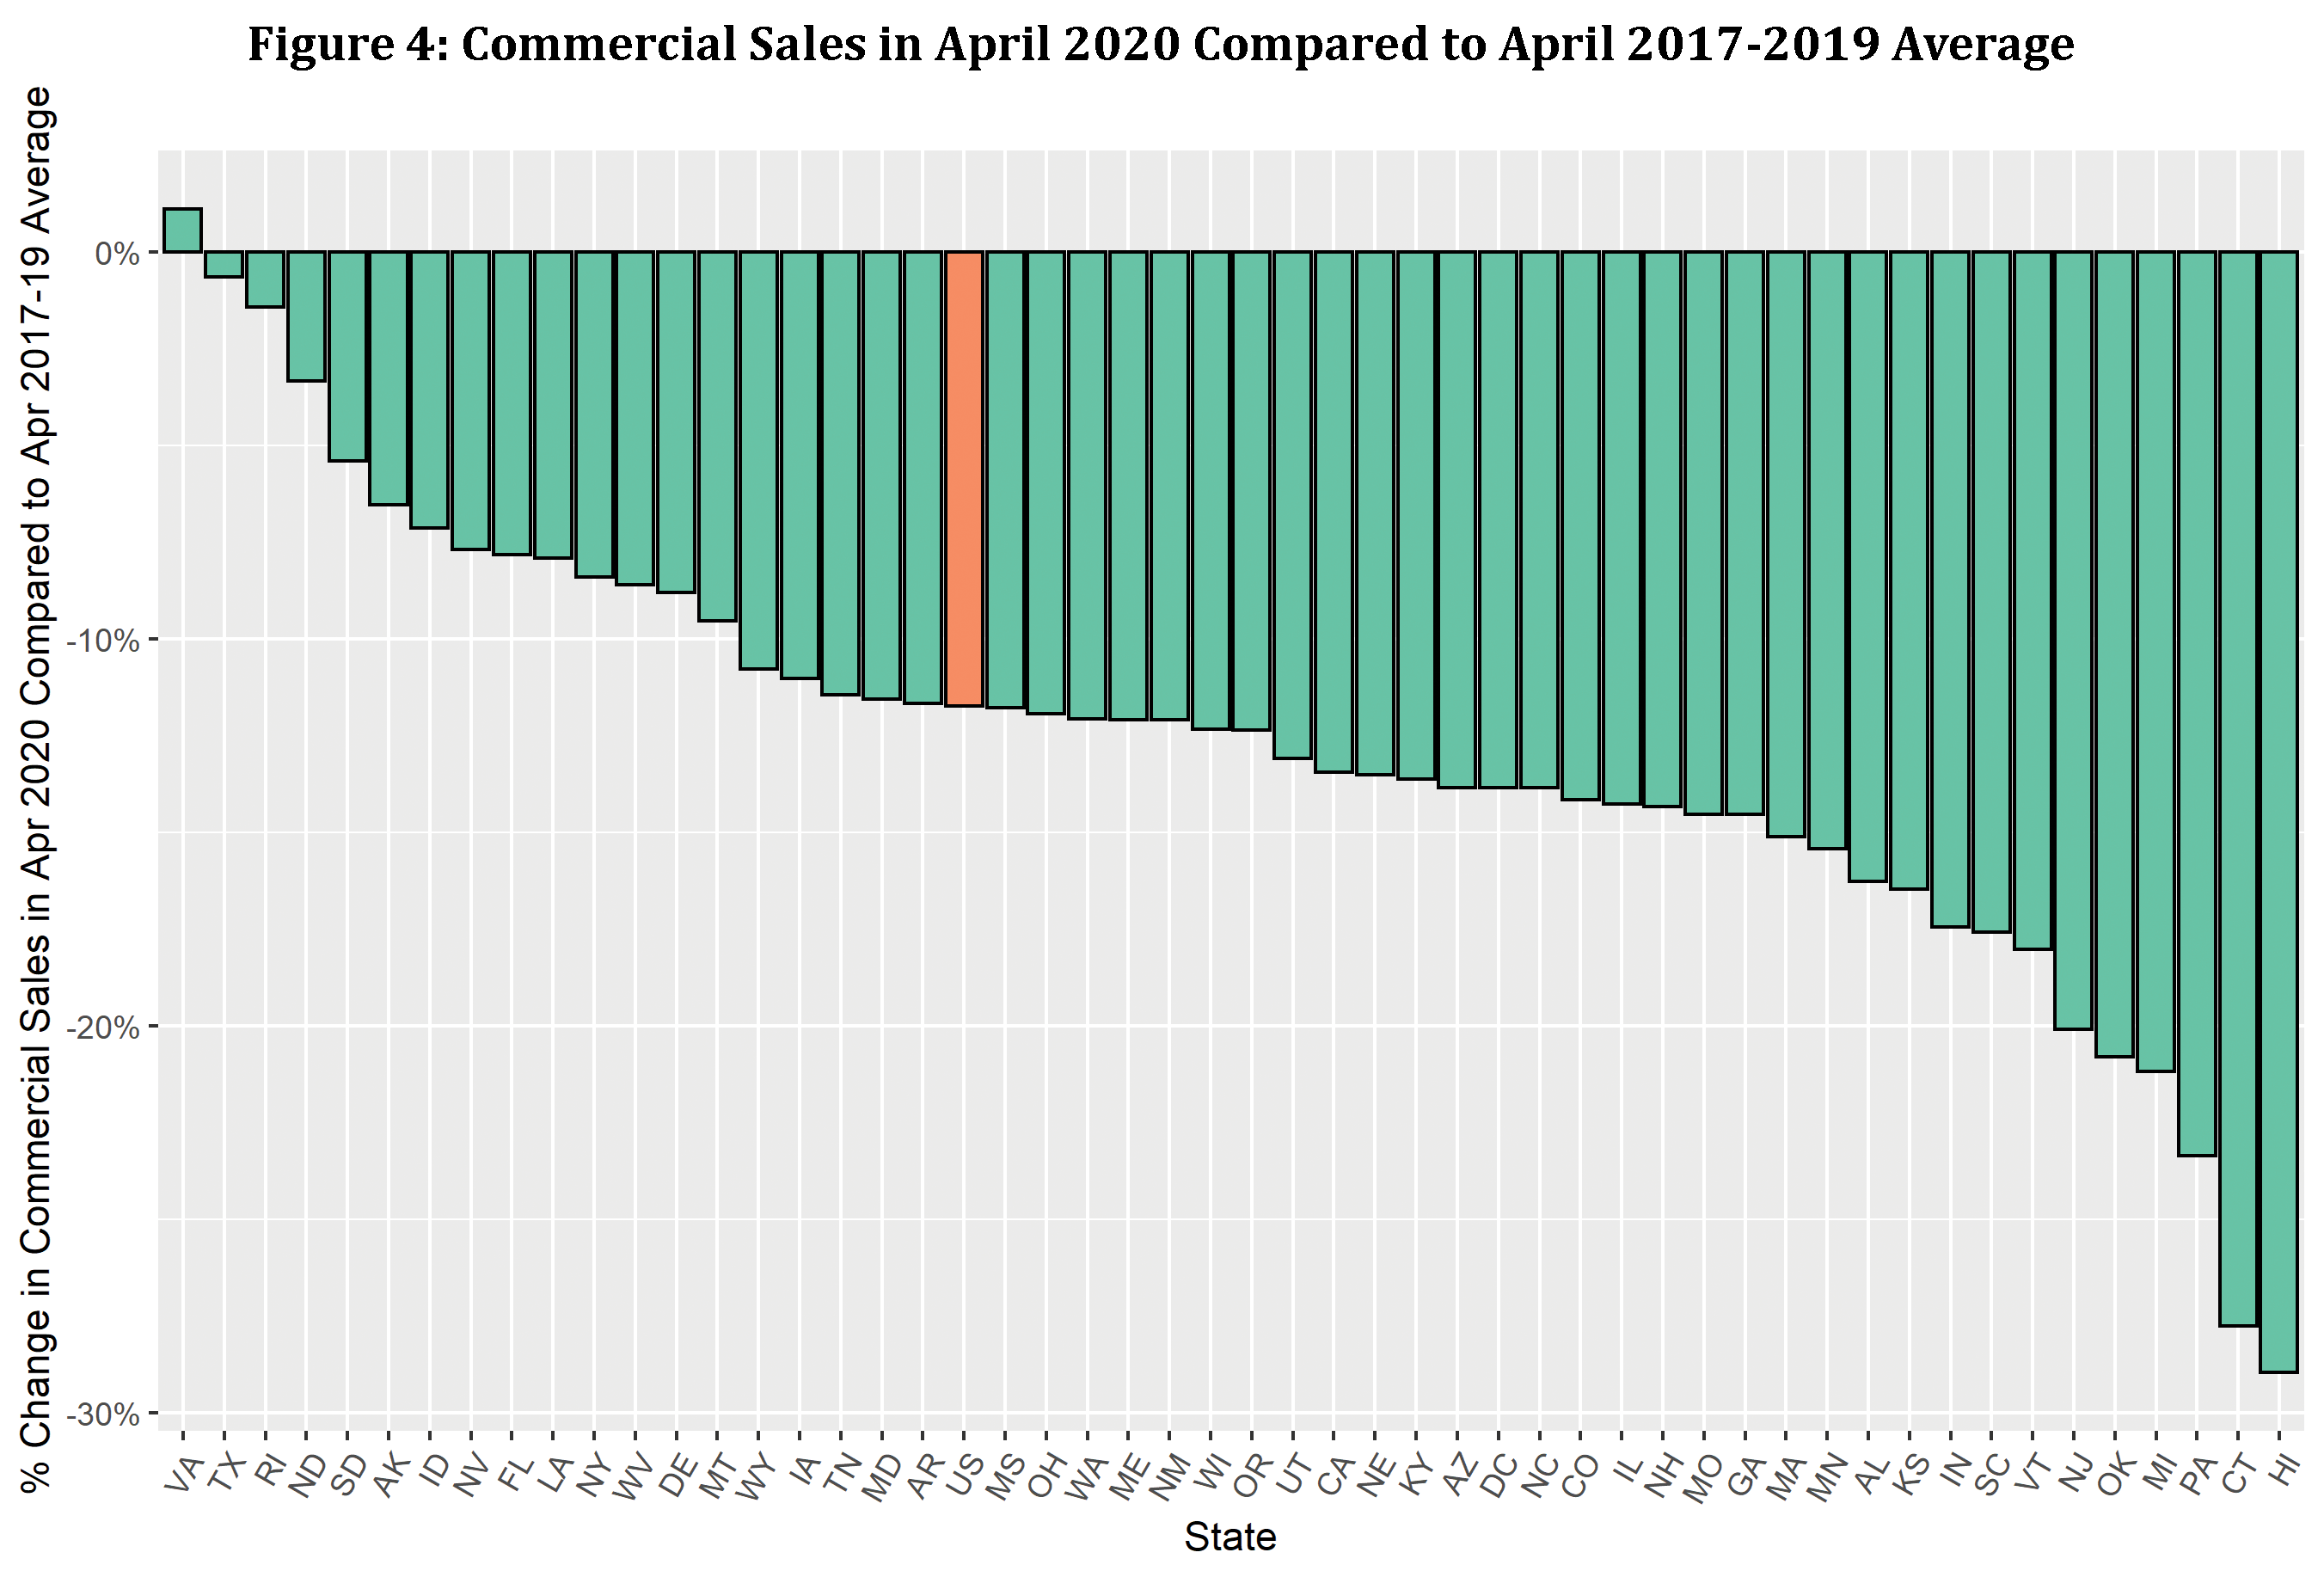
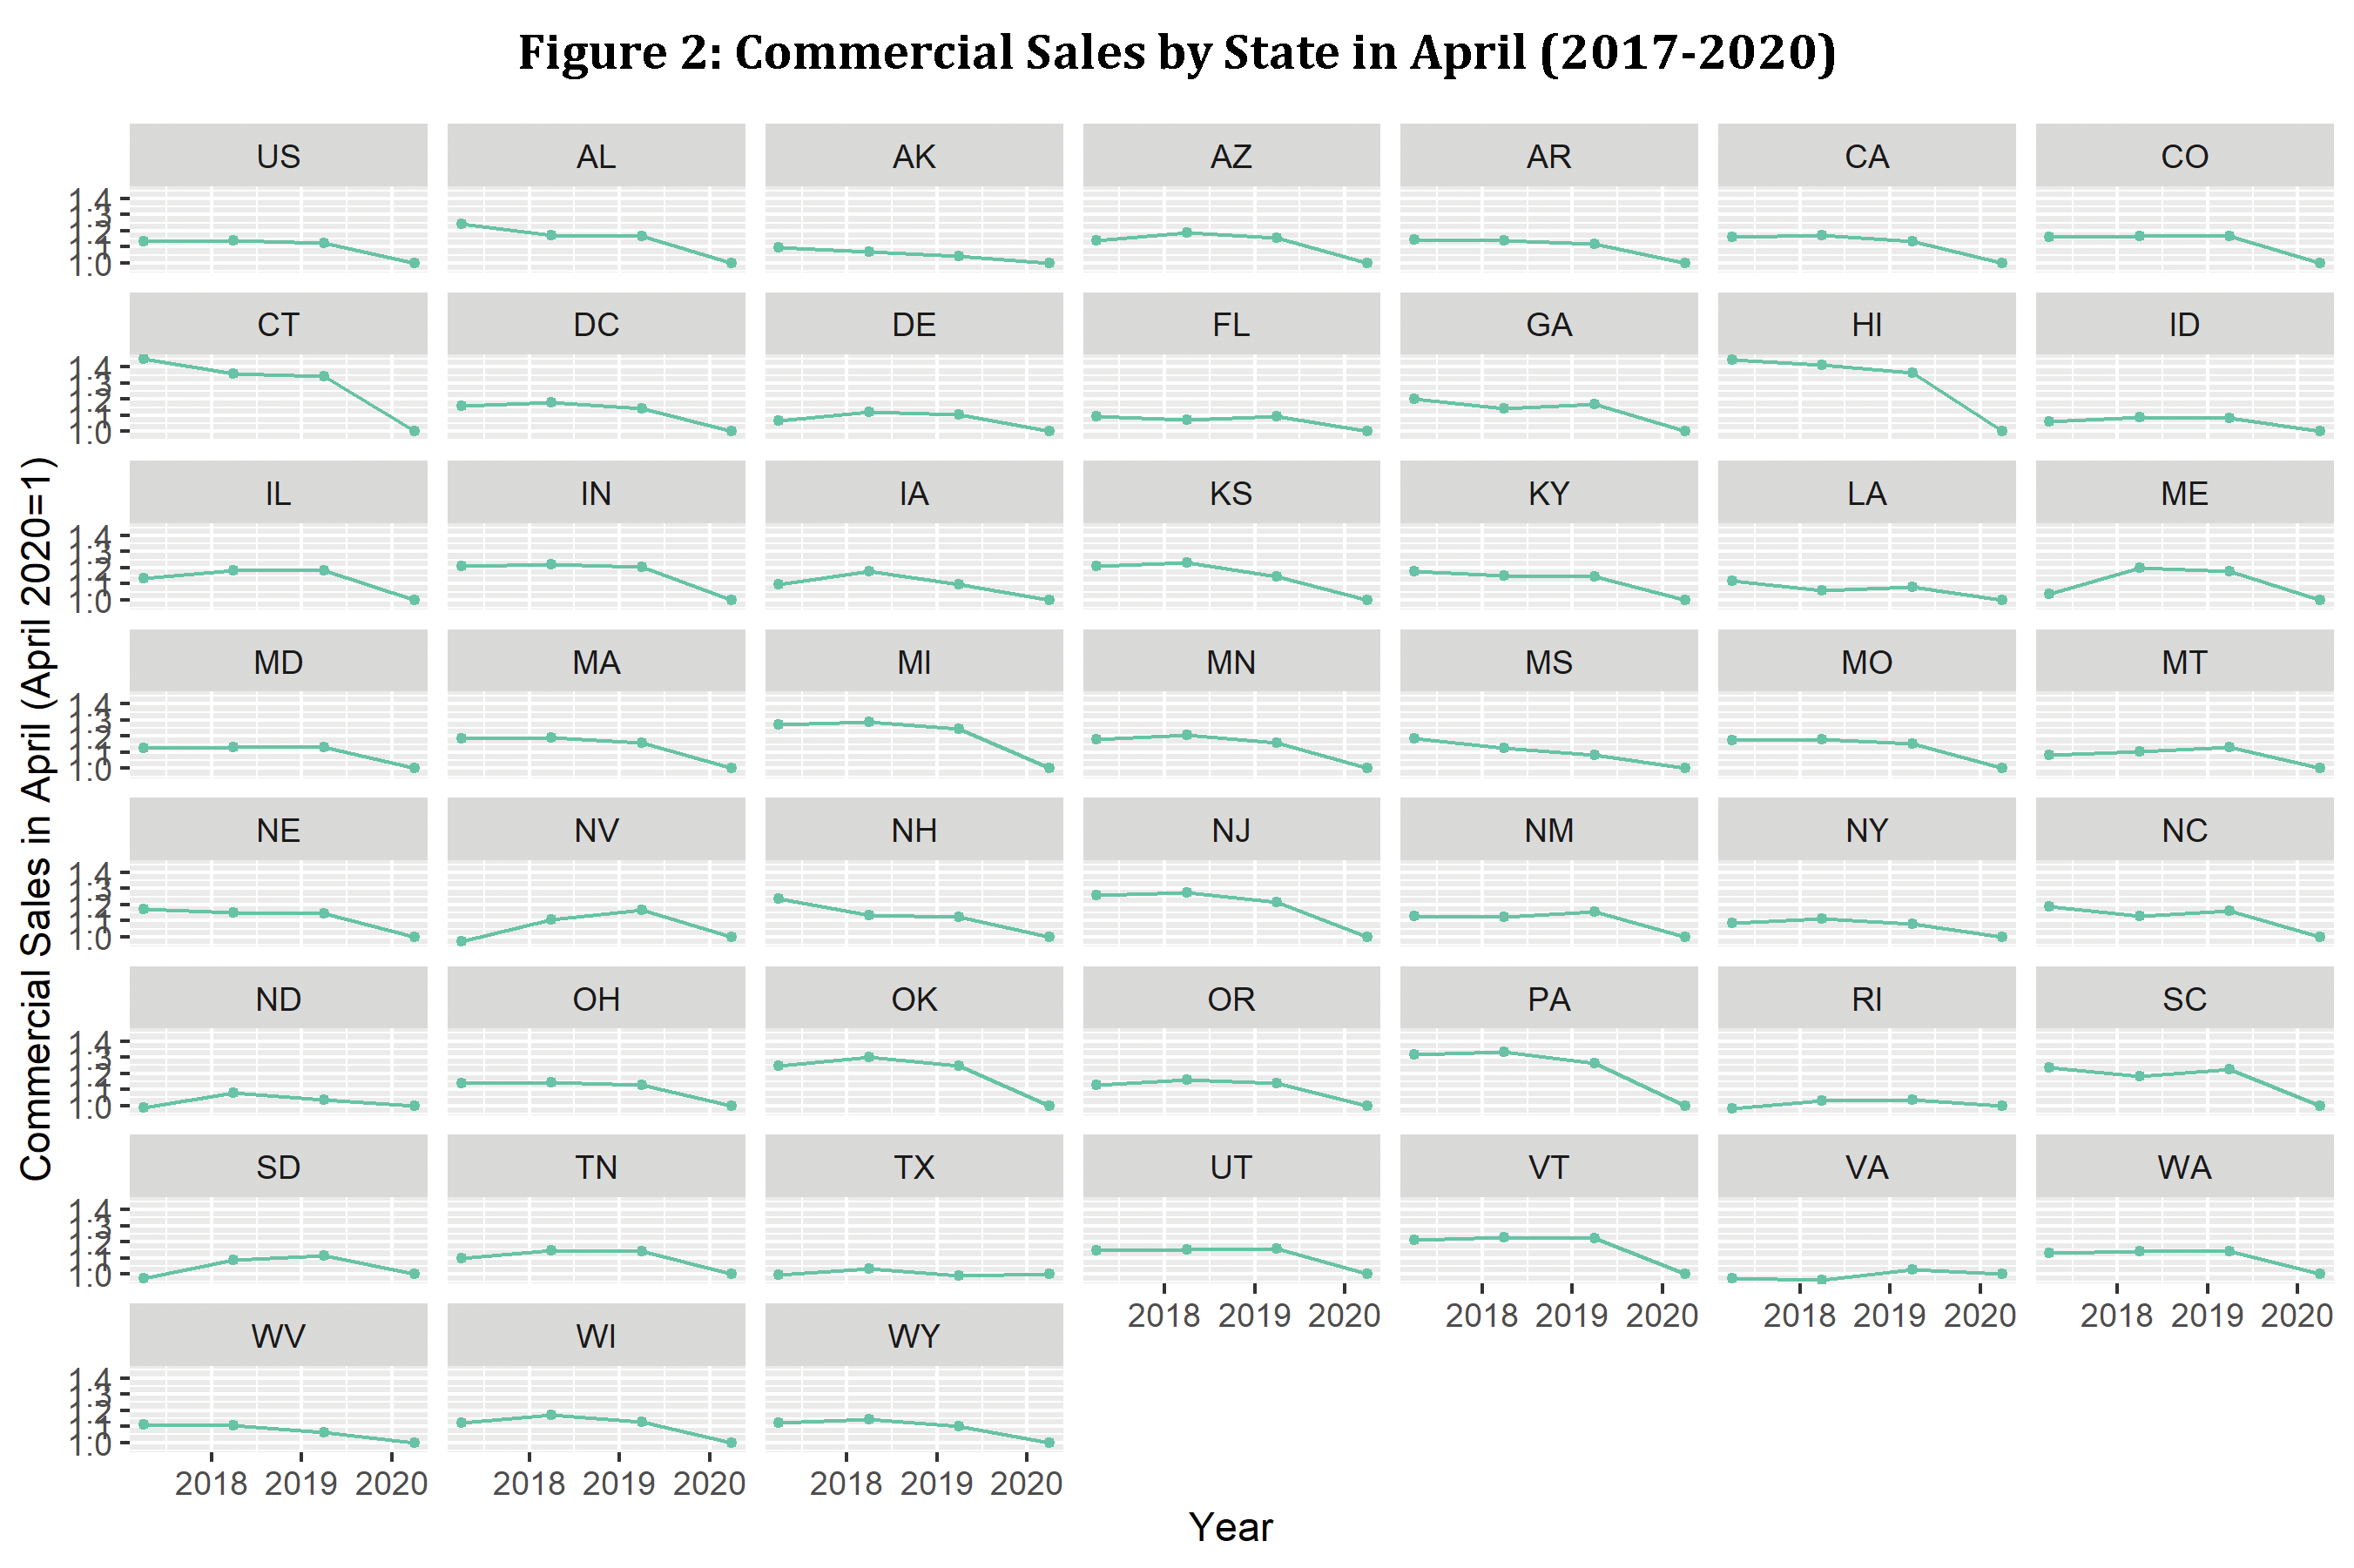
We can learn more by looking at sales patterns at a more granular level. We examined sales in April 2020 for each sector compared to the sales for the same month over the past five years at the state level. Generally speaking, the results were as expected for the commercial and industrial sectors. For most states, April 2020 had the lowest sales from commercial and industrial sectors when compared to the last five Aprils due to the slowdown caused by the pandemic. The April 2020 sales were 16% and 12% lower than April 2019 sales for the commercial and industrial sectors, respectively. The chart below shows commercial sales in each of the last four Aprils by state.

Utility Commercial Sales by State

April 2020 versus Average April 2017-2019

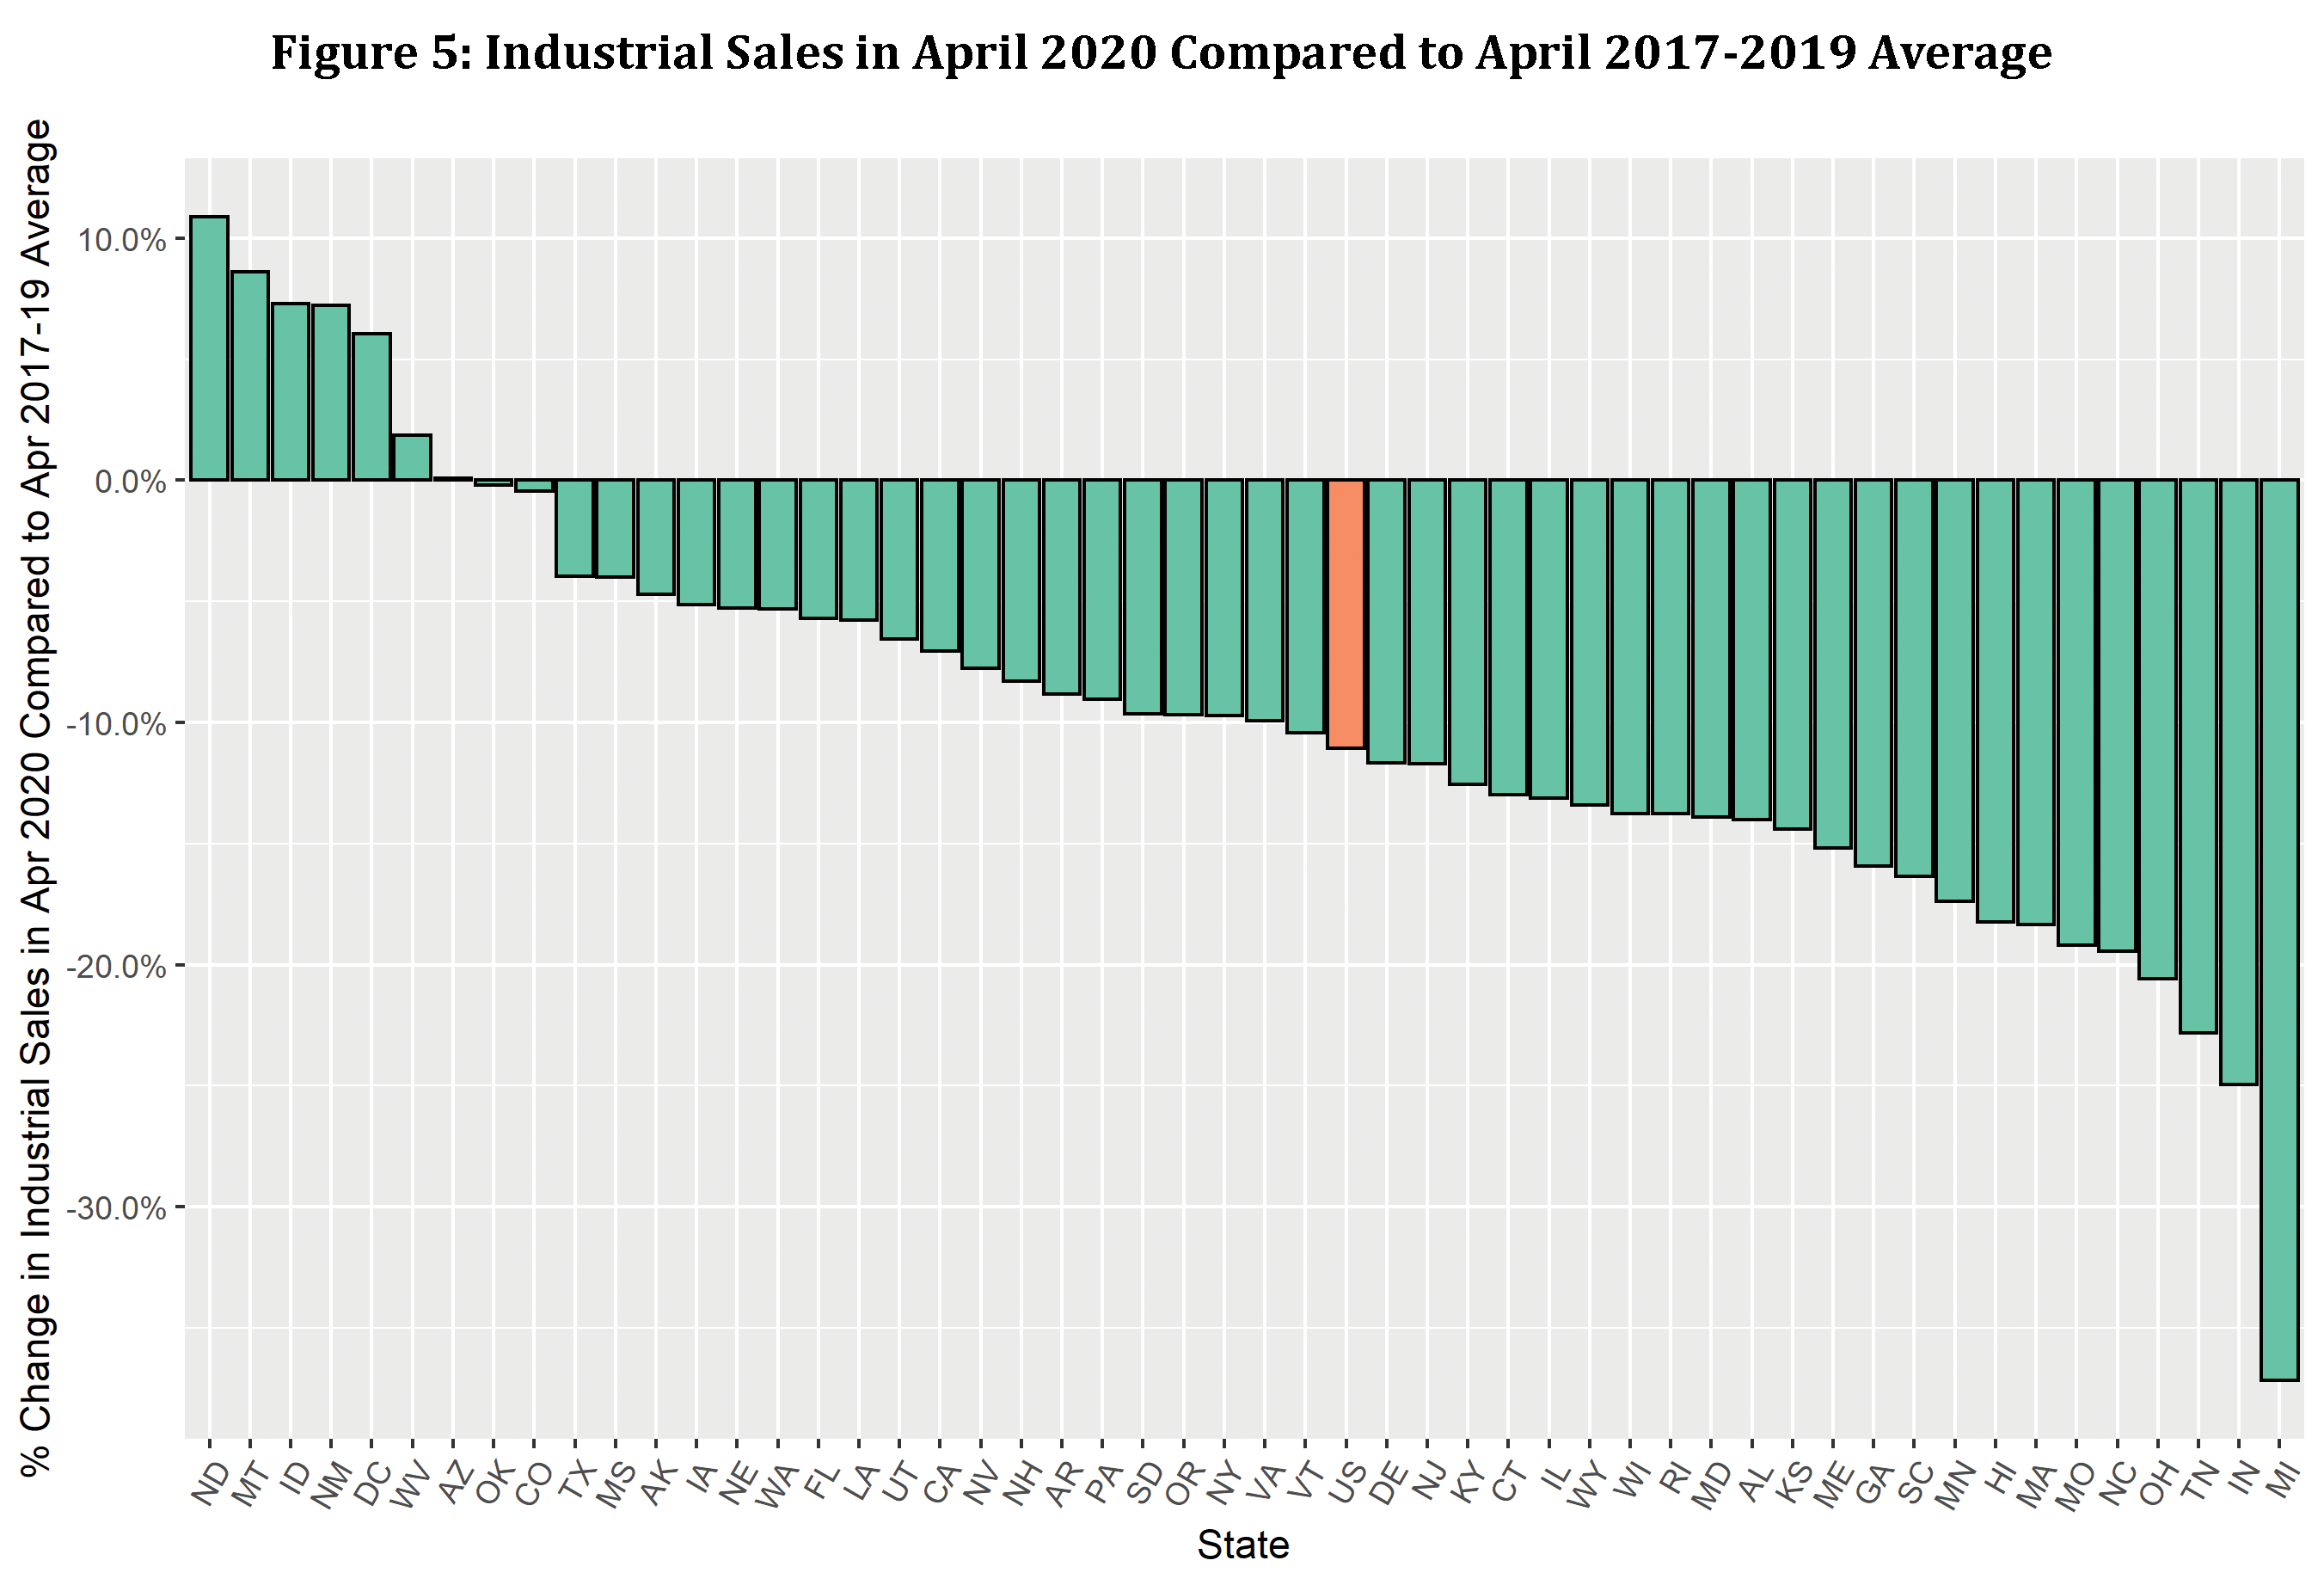
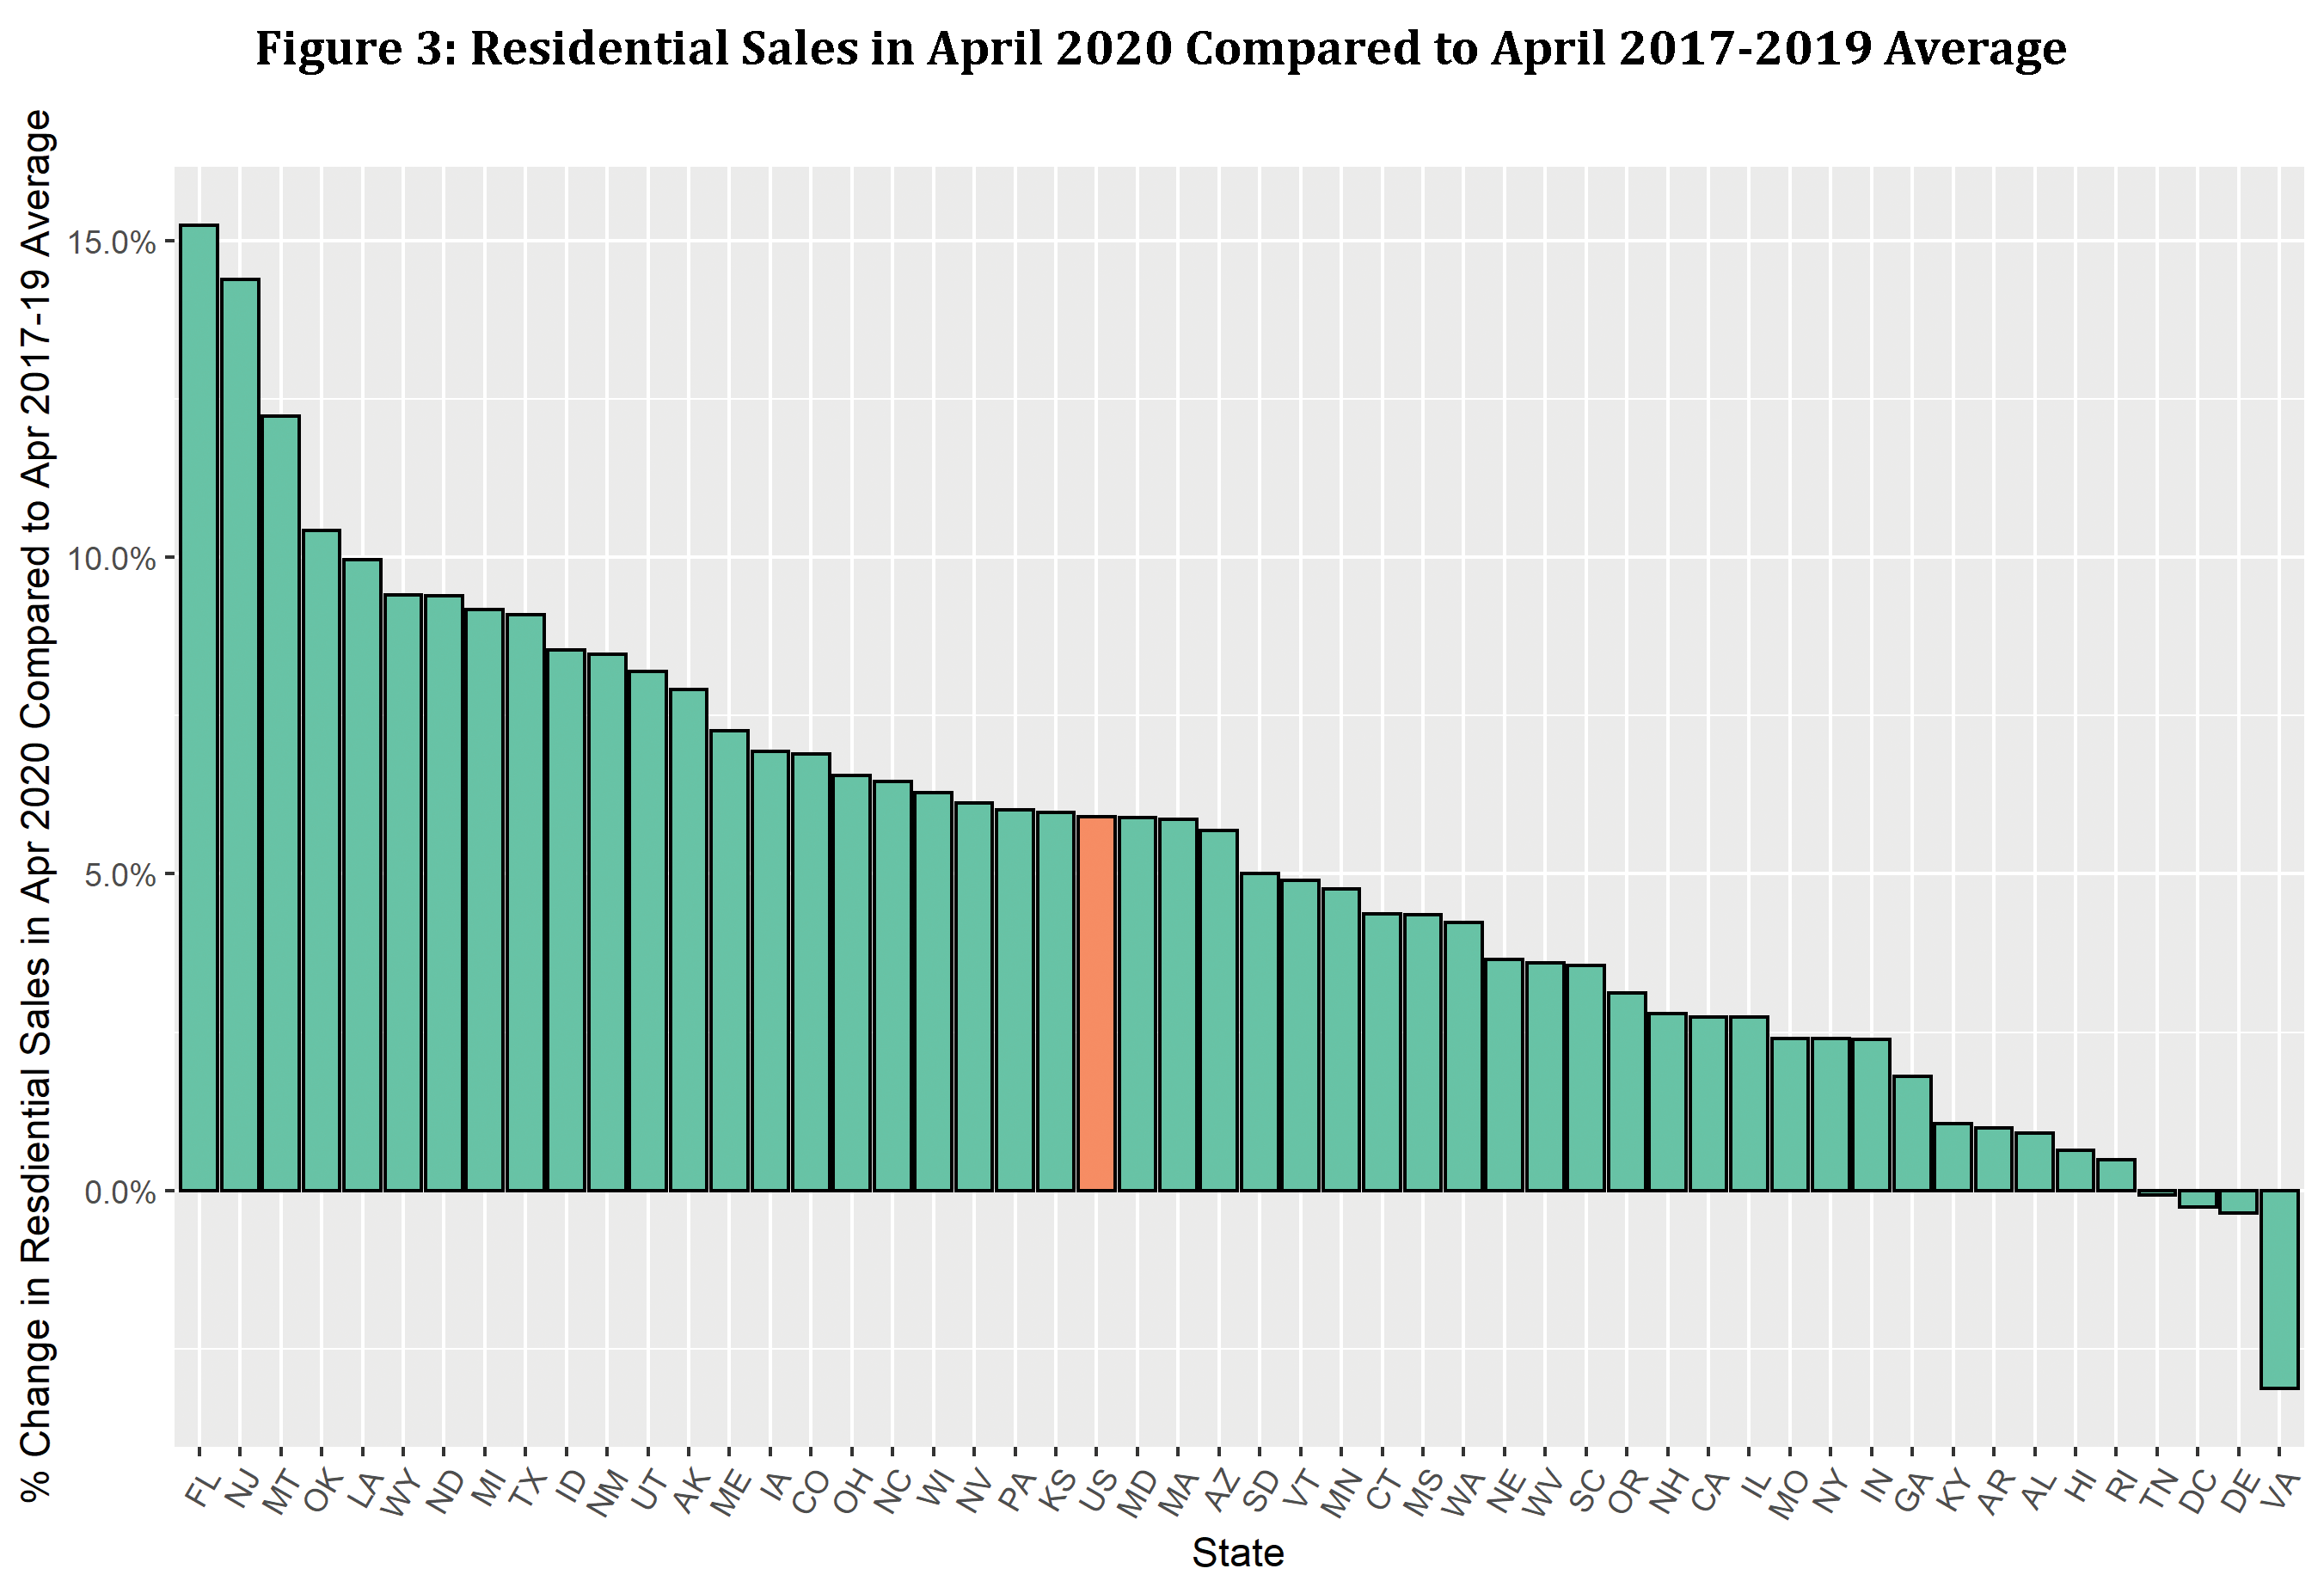
We wanted to analyze how April 2020 sales compared to the average April sales in the prior three years (i.e., 2017-2019) for each sector. As shown by the graphs below, April 2020 sales for the residential sector was higher than the April 2017-2019 average sales for all but four states. The percentage change in sales ranges from a high of approximately 15% to a low of roughly -3%.

April 2020 sales rates for the commercial and industrial sectors were lower than the April 2017-2019 average sales for all but one state for the commercial sector and all but seven states for the industrial sector.

Utility Residential Sales in April 2020

Utility Commercial Sales in April 2020

Utility Industrial Sales in April 2020

Revenue Impact of COVID-19

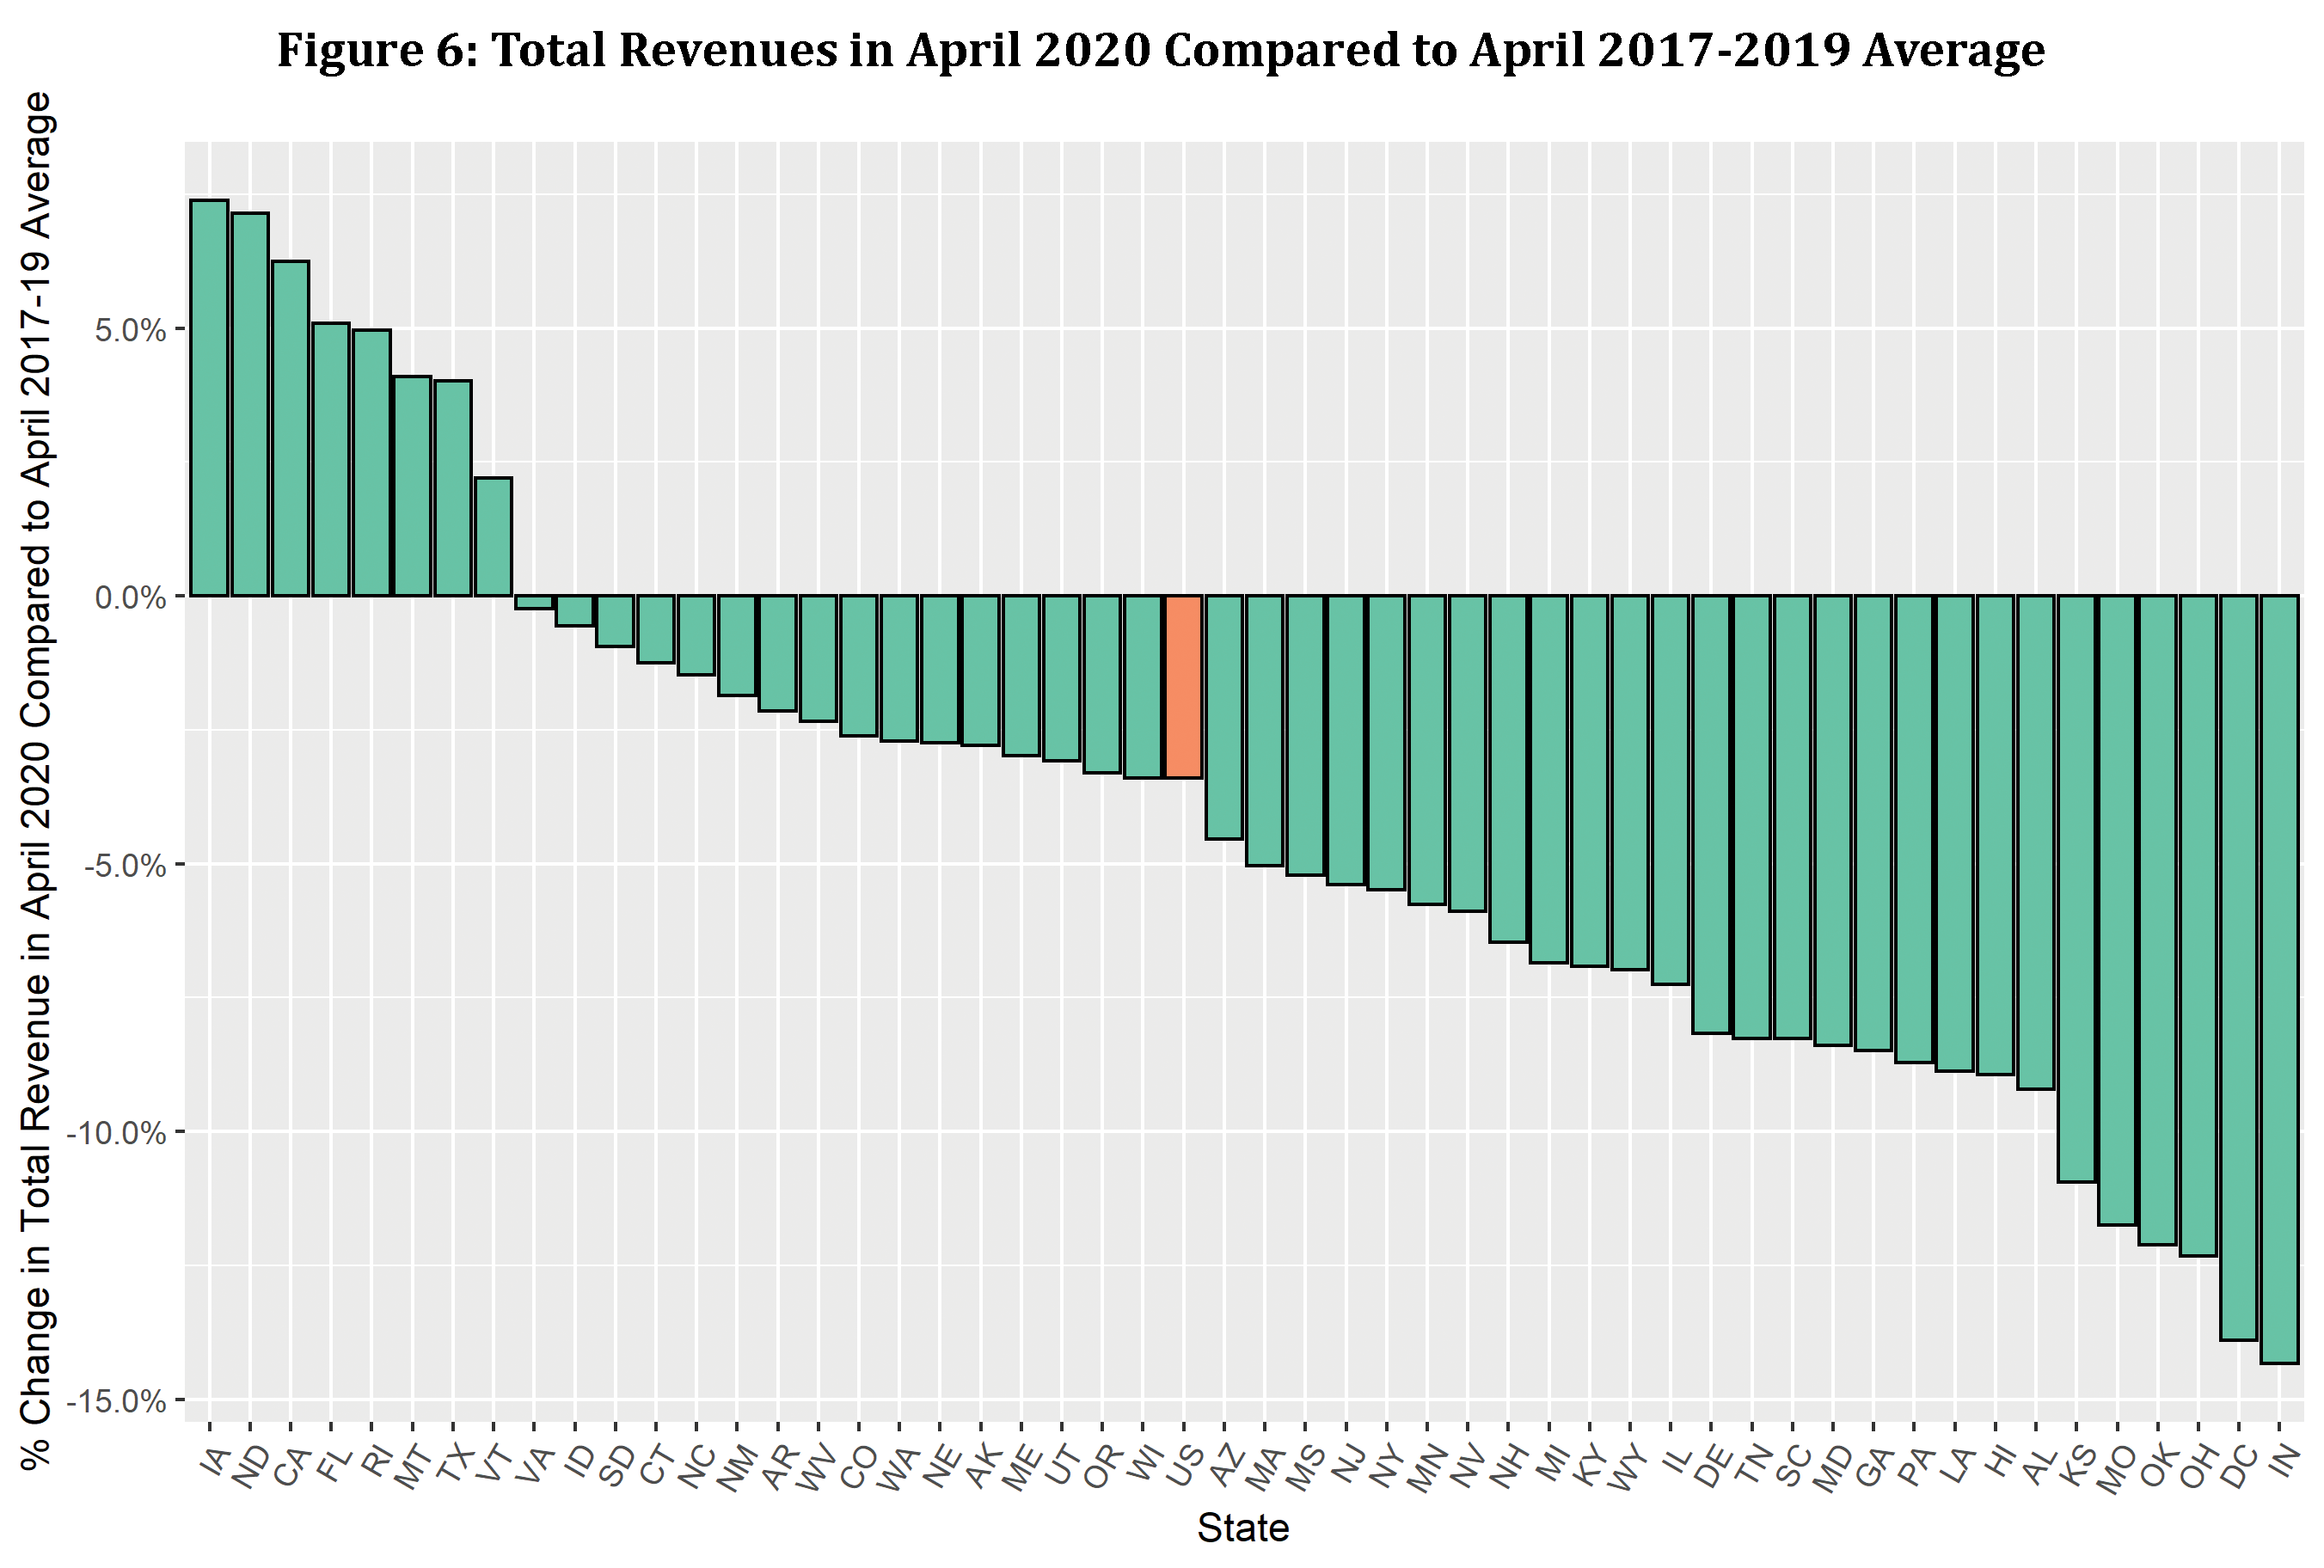
After establishing that residential sales had moved in the opposite direction to commercial and industrial sales, we analyzed the overall net impact on the revenues collected. We examined how much, if any, the loss in revenues from the commercial and industrial sectors would be offset by the increase in revenue from the residential sector. When we compared the change in total April 2020 revenues to the average April revenues in 2017-2019, the change in revenues followed a similar pattern as the change in total sales. It is important to note that non-payments may be driving a portion of the reduction in total revenue in April 2020 in addition to reduced load.

COVID Revenue Impact on Utilities

The critical question is: how will the change in load driven by the pandemic impact regulated utilities? The answer depends on each utility’s unique circumstances, some of which are listed below:

As next steps, we plan to analyze monthly data beyond April 2020 as it becomes available. The data for these later months, especially the summer months, will be crucial because those are the peak electricity sales months and peak revenue collection months. Drastic changes to sales during the summer months will have significantly more impact on revenues as compared to the months. Additionally, we also want to explore the various options available to utilities, regulators, and other stakeholders to address the COVID-19 related issues discussed herein.

More From Concentric:

COVID-19 Related Shutdowns Are Flattening the Curve of Electricity Demand: Experience in New York City

All views expressed by the author are solely the author’s current views and do not reflect the views of Concentric Energy Advisors, Inc., its affiliates, subsidiaries, or related companies. The author’s views are based upon information the author considers reliable. However, neither Concentric Energy Advisors, Inc., nor its affiliates, subsidiaries, and related companies warrant the information’s completeness or accuracy, and it should not be relied upon as such.

[1] Data was obtained from EIA using EIA’s API and the analysis was conducted in R, a free statistical software. The data used in this analysis is based on Form EIA-861M “Monthly Electric Power Industry Report”, which collects sales of electricity and associated revenue, each month, from a statistically chosen sample of electric utilities in the United States.

FERC’s Evolving ROE Methodology in a Period of Market Uncertainty

Published on July 23, 2020

By: Josh Nowak, Assistant Vice President

The Federal Energy Regulatory Commission (FERC) recently issued an Opinion which represents its latest iteration in its evolving methodology to determine just and reasonable returns on equity (ROE).  Opinion No. 569-A, issued on May 21, 2020, was a response to requests for rehearing on Opinion No. 569 in the Midcontinent Independent System Operator (MISO) proceeding.  In this decision, several changes were made to the methodology previously adopted in Opinion No. 569.

The methodology established in Opinion No. 569-A relies on an equal weighting of the Discounted Cash Flow (DCF) model, Capital Asset Pricing Model (CAPM), and Risk Premium model, with a detailed account of the source and calculation of each model input. Further, the calculation of both the range of presumptively just and reasonable ROEs, and the just and reasonable ROE determined in this case, relies on a rigid proxy group selection and averaging convention.

What FERC has not addressed, however, is whether this specific methodology would be appropriate in other circumstances. FERC has remained silent on the applicability of the methodology to other ongoing proceedings (e.g., the New England Transmission Owners [NETO] and Potomac-Appalachian Transmission Highline, LLC [PATH] proceedings), or how it will address the comments in its Notice of Inquiry (NOI) Regarding the Commission’s Policy for Determining Return on Equity. Another question is the applicability of the methodology in recently filed complaints and future proceedings. This question is particularly striking given the level of market uncertainty at the time Opinion No. 569-A was issued.

The recent uncertainty related to the economic consequences of coronavirus disease 2019 (COVID-19) suggests a higher level of risk in the marketplace as volatility has reached levels not seen since the Great Recession of 2008/09. In fact, the average of the Chicago Board Options Exchange Volatility Index (VIX) for the 6-month period ending May 31, 2020 was 31.32,[1] which is in the 95th percentile of six-month observation periods since the inception of the VIX. While utilities are sometimes viewed as a safe haven for investors, estimates of Beta coefficients suggest utilities are viewed by investors as riskier in recent months, and utilities’ level of risk has shifted more in line with the broader market. As shown below, estimates of Beta coefficients for the utility industry (as measured by the S&P 500 Utilities Sector), shifted from approximately 0.55 in early 2020 to approximately 0.85 in the period following the market turmoil associated with COVID-19.

Figure 1: S&P 500 Utilities Index – Estimates of the Adjusted Beta Coefficient in 2020[2]

Given this clear shift in capital market conditions, a reasonable question is whether the methodology adopted by FERC in Opinion No. 569-A appropriately accounts for the current market environment. The Beta coefficients discussed above are a significant input to the CAPM. In Opinion No. 569-A, FERC stated, “we find that the use of Value Line betas is appropriate for the CAPM calculation.”[3] While Value Line’s published estimates of Beta generally represent a reasonable estimate, there is a limitation based on Value Line’s quarterly publication schedule that can cause the most recently available Beta coefficient estimates from Value Line’s print-edition to become out-of-date with current market conditions. This limitation becomes apparent in the current capital market environment, where there has been a rapid and significant increase in volatility.

For example, at the time Opinion No. 569-A was released, the most recently available Value Line print-edition reports for companies classified as “Electric Utilities (East)” were published in mid-February 2020, when the average utility Beta coefficient was 0.55. As such, the most recent reports failed to reflect then-current market conditions as the average utility Beta coefficient had increased to 0.85 by May 21, 2020.[4] Not surprisingly, when Value Line updated its Beta coefficients in the mid-June publication of “Electric Utilities (East)” reports, the average Beta coefficient for these companies increased from 0.53 to 0.84.[5] Nonetheless, applying the CAPM methodology described in Opinion No. 569-A at the end-of-May would require relying on the mid-February reports (the most recent publication available for certain companies) containing stale data that no longer reflected current market conditions. Therefore, to analyze the reasonableness of ROEs at the end-of-May, FERC would have to revisit the appropriateness of Value Line Beta coefficients since several estimates failed to reflect current capital market conditions at that point in time.

No single approach or methodology is right at all times, in all capital market conditions. Therefore, it is important that analysts and regulators apply informed judgment when determining the reasonableness of each input to the models, as well as the result of each model in the context of current capital market conditions. While the example discussed above focuses on Beta coefficients, there are several factors that would have to be reevaluated based on recent developments in capital markets relative to the conditions at the time of the analysis applied in Opinion No. 569-A. The extensive intervention of the Federal Reserve to stabilize market conditions has had a significant effect on several other inputs to the DCF, CAPM, and Risk Premium analysis. Much like the Beta coefficients described above, the effect of Federal Reserve intervention on interest rates, dividend yields, and market returns must be analyzed to determine the appropriateness of each input in estimating investors’ expectations of required returns. As established under Hope and Bluefield, the means of arriving at a fair return is not controlling; it is only the end result that leads to just and reasonable rates.[6]

More From Concentric:

Advancing FERC’s Methodology for Determining Allowed ROEs for Electric Transmission Companies

Factors Influencing Utility Cost of Capital in a Period of Market Turmoil

All views expressed by the author are solely the author’s current views and do not reflect the views of Concentric Energy Advisors, Inc., its affiliates, subsidiaries, or related companies. The author’s views are based upon information the author considers reliable. However, neither Concentric Energy Advisors, Inc., nor its affiliates, subsidiaries, and related companies warrant the information’s completeness or accuracy, and it should not be relied upon as such.

[1] Source: Bloomberg Professional. For comparison, the long-term average on the VIX is 19.42.

[2] Source: Bloomberg Professional, adjusted Beta coefficients, five years of weekly returns on the S&P 500 Utilities Index relative to the S&P 500 Index.

[3] 171 FERC ¶ 61,154 (Opinion No. 569-A, May 21, 2020) at para 76.

[4] Beta coefficient estimates were derived from Bloomberg Professional. Value Line Beta coefficients are calculated based on five years of weekly returns against the New York Stock Exchange Composite Index. Bloomberg allows you to select the parameters for calculating Beta. In this analysis, Bloomberg Beta coefficients are calculated on five years of weekly returns against the S&P 500, which is generally consistent with Value Line’s methodology, but allows for more current data to be used.

[5] Source: Value Line, based on the simple average of all companies classified as Electric Utilities (East).

[6] Federal Power Commission v. Hope Natural Gas Co., 320 U.S. 591 (1944) (“Hope”); Bluefield Waterworks & Improvement Co., v. Public Service Commission of West Virginia, 262 U.S. 679 (1923) (“Bluefield”).

Are Demand Charges Appropriate for Sending Price Signals for Electric Distribution Systems?

Published on June 26, 2020 

By: Team Concentric

This article is the second in a series addressing the changing environment for regulated utility pricing given advances in Distributed Energy Resource technology, data availability, and customer preferences. Part One, Renewable Distributed Generation and Pricing Challenges, addressed the issue of Net Energy Metering.

Demand charges have been a component of electric utility pricing design for many decades. The original arguments for demand charges were developed by John Hopkinson[1] and further summarized by James Bonbright:

“The full rationale of this Hopkinson, two-part rate is far from simple. But the rationale usually given (although it will serve only as a first approximation) is that the two-part rate distinguishes between the two most important cost functions of an electric-utility system: between those costs that vary with changes in the system’s output of energy, and those costs that vary with plant capacity and hence with the maximum demands on the system (and subsystems) that the company must be prepared to meet in planning its construction program.”[2]

However, industry experts are now debating whether demand charges are an appropriate pricing mechanism, in particular for smaller customers (e.g., residential customers). Some compelling arguments against demand charges to consider:

·         Demand charges do not send proper price signals to customers.

·         Demand charges are expensive to implement.

·         Customers do not understand demand charges.

·         Customers cannot react and/or respond to demand charges.

·         No cost support exists for demand charges; they do not reflect the incremental cost to use the distribution system.

·         Distribution investments should be recovered by some form of energy charge.

In this article, we limit the debate to electric distribution systems. We will assess the arguments for and against demand charges and determine if demand charges are an appropriate mechanism in an electricity pricing design.

The Economics of an Electric Distribution System

One of the traditional arguments for the regulation of utilities is the existence of natural monopolies. A natural monopoly is defined as an industry with economies of scale, which results in the long-run marginal cost below the average cost for a single producer. Given the economies of scale associated with electric distribution systems, it is only economically efficient for a single system to exist within a given geographic area.

Unlike competitive markets, where prices are established at the marginal cost of production, a natural monopoly must set prices above the marginal cost. The revenues generated by marginal cost prices are insufficient to financially support the system. Therefore, the challenge for a natural monopoly is to determine how to recover the additional needed revenue in a manner that is considered equitable and sends a proper price signal to the customer.

In the energy industry, experts have argued that distribution systems are not constructed to serve demand and that their cost structure is fixed. To address such arguments, the authors consulted on the design of electric distribution systems with Anthony (Tony) Hurley. Mr. Hurley is an electric distribution system expert with over 30 years of experience. He is currently a Consultant at Critical Preparedness, LLC and previously held a leadership role in Electric Distribution at FirstEnergy as Vice President of Operations at Jersey Central Power & Light. Mr. Hurley stated:

Every customer on a distribution circuit, whether residential, commercial, or industrial, has a load profile that mirrors their load usage and peak demands, with the data being captured by the utility. From this demand information, distribution engineers are able to make investment decisions and reconfigure circuits if loads may exceed equipment ratings, and forecast the need for capital projects, including equipment upgrades and possibly new substations to address peak loads. To accept the premise that demand information is not used in Distribution Planning is incorrect.

Ultimately, the planning function for a distribution system is based upon expectations of demand growth within that system. For a system operator to send the correct price signal to customers, the distribution system should be priced at the long-run marginal cost.

Definition – What is Demand?

Traditional definitions of demand, (e.g., the maximum level of consumption by a customer averaged over a time period such as a one-hour or 15-minute interval), imply a one-way flow of power from the utility to the customer. However, the traditional definition of demand is no longer applicable in a world with Distributed Energy Resources (DER). The growth of DER means that a utility is now required to plan not only for an inflow of electricity to the customer, but an outflow from that same customer to the distribution system if their DER output exceeds consumption at a given point in time. A specific example of this is a customer with a small residential solar array who draws energy at night when the panels are not generating power, but during the day may produce more than they consume. Therefore, a pricing mechanism designed for demand could be characterized as an “option.” Customers would purchase an option designed to allow them to use a system up to a certain quantity of demand, either received or injected into the distribution system. This behavior would provide proper production signals to the utility, guiding better-informed investment.

Arguments Commonly Made Against Demand Charges

Argument 1: “Demand Charges Do Not Reflect the Incremental Cost of Using the Grid”

An argument is often made that demand charges do not reflect the incremental cost to serve customers, but instead are based upon average embedded costs. As a result, they would send a false price signal to customers. Some truth can be ascribed to this statement if the pricing design follows an embedded cost of service approach.

However, the development of long-run marginal cost of service is possible; such studies have been performed by many utilities in the last several decades. A traditional approach to developing demand charges based upon average embedded costs can be problematic. Still, recent innovations have included a more detailed analysis of the distribution cost structure and the impact of DER.

Argument 2: “Demand Meters are Expensive to Implement

To create and implement a demand charge, the customer premises must be outfitted with metering equipment, which is capable of measuring that customer’s demand in real-time. A traditional argument against implementing demand charges for residential and small commercial customers is that the incremental cost of this metering technology is expensive, and it is not cost-beneficial to install the metering technology on a system-wide basis.  Although this may have been true in the past, it is no longer accurate.

Metering technology costs have dropped dramatically in the last several decades.  The replacement of electromechanical technology with today’s Advanced Metering Infrastructure (AMI) equipment has reduced costs and increased reliability in many instances. Further, the cost of data management has decreased, allowing for more complex billing structures to be easily processed and delivered to customers. Modern metering equipment associated with AMI generally has the capabilities to provide revenue quality demand charges as well as other, more advanced pricing designs.

Argument 3: “Customers Do Not Understand Demand Charges”

Many parties have argued that customers, especially residential customers, are unable to understand the complexities of demand charges. They claim that traditional utility tariffs for smaller customers, based solely on two-part pricing designs (i.e., a fixed charge and an energy charge), remain appropriate.

We believe a discerning customer is able to navigate demand charges for the following reasons:

Underestimating the ability of customers to understand electric tariff designs is a mistake that simply reduces the number of service and pricing options available to residential customers. Given that such options are in many cases feasible, the result is fewer choices for residential customers, increased cross-subsidization, and potential increases in the utility revenue requirement, which could be avoided.

We agree that the introduction of new tariff designs, including demand charges, should include an education process for customers, but advanced pricing concepts should not be written off solely due to the perception that customers will not understand them.

Argument 4: Customers are Unable to React to Demand Charges

Some parties argue that customers cannot react to demand charges given the tariff design.  We reject this argument because:

Argument 5: Distribution Investments Should be Recovered by an Energy Charge

The last argument proposes to recover the costs of the distribution system through an energy charge.  Recovering distribution costs through an energy charge is deficient on several fronts and should be rejected for the following reasons:

 How Should the Non-Incremental Cost of the Distribution System be Recovered?

A question that has challenged the utility industry for many years is how to recover costs which exceed the long-run marginal costs to operate the distribution, or “Residual Costs.” That question will be addressed in the next paper in our series “The Application of Access Charges.”


For more information on the topics discussed in this article, please contact Tom O’Neill.


More From Concentric:

Renewable Distributed Generation and Pricing Challenges

All views expressed by the authors are solely the authors’ current views and do not reflect the views of Concentric Energy Advisors, Inc., its affiliates, subsidiaries, or related companies. The authors’ views are based upon information the authors consider reliable. However, neither Concentric Energy Advisors, Inc., nor its affiliates, subsidiaries, and related companies warrant the information’s completeness or accuracy, and it should not be relied upon as such.


[1] Hopkinson, John R., 1892. On the Cost of Electricity Supply, Transactions of the Junior Engineering Society. Vol. 3, No. 1, p1-14.

[2] “Principles of Public Utility Rates”, Public Utility reports, Inc. by James C. Bonbright. First edition 1961, page 310.

Renewable Distributed Generation and Pricing Challenges

Published on May 28, 2020

By: Team Concentric 

Overview 

In April 2020, the Kansas Supreme Court (KSC) overruled the Kansas Corporation Commission and a lower courts order on a tariff which Evergy, the local power utility, explicitly developed for customers operating behind the meter Renewable Distributed Generation (RDG) systems. The KSC opinion stated that the requirement for RDG customers to take service under a separate tariff from their non-RDG peers constituted discrimination under K.S.A. 66-117d of the Kansas Public Utilities Act, which states:  

“No electric or gas utility providing electrical or gas service in this state shall consider the use of any renewable energy source other than nuclear by a customer as a basis for establishing higher rates or charges for any service or commodity sold to such customer nor shall any such utility subject any customer utilizing any renewable energy source other than nuclear to any other prejudice or disadvantage on account of the use of any such renewable energy source.” 

This emphasizes how legal venues such as the KSC offer opinions based upon legal interpretations and not the broader policy issues that state and federal regulators consider in evaluating pricing designs proposed and implemented by regulated utilities. Provided below is a discussion of many of the various issues that should be addressed in developing a pricing design that fulfills the needs of current and potential RDG customers while limiting the adverse impact on other customers. 

Evergy’s Proposed Tariff

Evergy’s proposed Residential Standard Distributed Generation tariff (the “DG tariff”) differs from their typical Residential Service tariff in that it is a three-part tariff. The pricing design contains a fixed monthly charge, a volumetric energy charge, and a demand charge. Evergy’s existing Residential Service tariff contains only a monthly fixed charge and an energy charge. Both tariffs are seasonally differentiated with a higher energy charge during high-usage summer months than during winter months.

Given that the fixed monthly charge for these two tariffs is identical, the main differences between them are:  

  1. The DG tariff contains a demand charge 
  2. The Residential Service tariff has a higher energy charge, which captures the capacity costs as well as usage

Is a Pricing Design Specifically for DG Customers Discriminatory? 

Traditional pricing design theory looks at the following attributes to determine if customer groups should be split into different tariffs: 

Since these questions must be answered by any utility proposing such a tariff, most analyses have found different load shapes and load factors between DG and non-DG customers. Further, a difference exists in the type of DG equipment being utilized. These conclusions are logical if you assume that a customer has installed photovoltaic (PV) DG, which operates when the sun is shining; the resulting load shape would undoubtedly differ from a customer without PV DG equipment installed 

Does Cost Shifting Occur? 

Most jurisdictions require that the rates charged are “just and reasonable.” Though the definition of “just and reasonable” is broadly defined and subject to various interpretations, a commonly accepted simple explanation is the equitable treatment of all classes of customers. Equity is often measured through an allocated cost of service analysis or, less frequently, through a marginal cost revenue study.

Many studies have identified significant cost differentials between DG customers and non-DG customers when they are served under the same tariff. For example, a study performed by the author in Puerto Rico produced a revenue deficiency approximately 500 percent greater for DG customers compared to non-DG customers.

Cost shifting can occur when simple DG compensation approaches, such as Net Metering, are implemented as a substitute for a more sophisticated (i.e., unbundled) pricing design. Many jurisdictions adopted Net Metering as straight forward pricing approach, which is often predicated upon a limit to the number of DG customers who are allowed to receive service under such tariffs. When rooftop PV technologies were a novelty, the impact of the cost shifting on other customers was less significant. However, as DG saturation has increased, the cross-subsidization problem inherent in approaches like Net Metering has grown 

What is the Solution? 

As a foundation, we suggest revisiting Bonbright’s[1] Criteria for sound rate design. Bonbright suggested pricing solutions that treated all customers equitably and promoted the efficient use of resourcesWhile Bonbright first proposed his principles almost sixty years ago, they remain applicable today. 

Ultimately, there are existing pricing solutions that could help mitigate the challenges of DG adoption. The key principles are rooted in the efficient usage of the electric power system and sending price signals that promote the adoption of technologies to achieve societal goals.


For more information on the topics discussed in this article, please contact Tom O’Neill.


More From Concentric:

Are Demand Charges Appropriate for Sending Price Signals for Electric Distribution Systems?

[1] “Principles of Public Utility Rates,” Public Utility reports, Inc. by James C. Bonbright, Albert L. Danielsen and David R. Kamerschen. Second edition March 1988, pages 383-384.

All views expressed by the authors are solely the authors’ current views and do not reflect the views of Concentric Energy Advisors, Inc., its affiliates, subsidiaries, or related companies. The authors’ views are based upon information the authors consider reliable. However, neither Concentric Energy Advisors, Inc., nor its affiliates, subsidiaries, and related companies warrant the information’s completeness or accuracy, and it should not be relied upon as such.
Responding to a Severe Economic Downturn

Published on May 28, 2020

By: Bob Yardley, Senior Vice President

The current economic downturn will likely spare no one, including utilities and their customers, communities, and employees. While this presents operating and financial challenges for utilities, it also creates opportunities to leverage their public service standing by helping customers and communities during a time of need. However, a response calls for a sense of urgency and innovative solutions.

Our hospitals provide inspiration. Despite facing serious financial challenges, hospitals in the hardest hit areas have repurposed their organizations: converting entire floors to ICUs, reassigning and retraining staff, and engaging in outreach to other hospitals throughout the world for best practices.

Utilities face financial challenges from declining commercial and industrial sales, increased expenses, and diminished productivity. As we have learned in working with our utility clients, there are many feasible solutions to these issues. The specific response depends on where the utility is with respect to ongoing rate case litigation, the terms of an existing rate plan, and their regulatory and political environment. Regulators have a large tool kit to respond to unforeseen circumstances that impact utilities and their customers. Many utilities are assessing their options and engaging with regulators and other stakeholders to identify appropriate solutions.

These responses will preserve the financial health of utilities, but we must acknowledge the pressures that regulators and other policy makers are facing. Our team includes former regulators that served during recessions, allowing them to identify innovative solutions that address these pressures and help the hardest hit communities. This includes new innovative services and programs targeted to residential and small business customers, many of whom are impacted by the current economic downturn.

The best solutions will be those that can be designed and implemented quickly and address the needs of customers, communities, and regulators.

For more information regarding Concentric’s expertise in finance, regulation, rates, policy, grid modernization, emerging business models, and new program and service innovation, please contact Bob Yardley.

All views expressed by the author are solely the author’s current views and do not reflect the views of Concentric Energy Advisors, Inc., its affiliates, subsidiaries, or related companies. The author’s views are based upon information the author considers reliable. However, neither Concentric Energy Advisors, Inc., nor its affiliates, subsidiaries, and related companies warrant the information’s completeness or accuracy, and it should not be relied upon as such.
Advancing FERC’s Methodology for Determining Allowed ROEs for Electric Transmission Companies

Published on May 12, 2020

Concentric Energy Advisors recently produced an important report at the request of Edison Electric Institute which proposes several fundamental changes to the Federal Energy Regulatory Commission’s (“FERC” or the “Commission”) methodology used to determine the composite zone of reasonableness and base return on equity (“ROE”) for regulated electric transmission utilities. In this report, we respond to FERC’s ROE methodology as it has evolved from Opinion No. 531 for the New England Transmission Owners (“NETOs”), Opinion No. 551 for the transmission owners in the Midcontinent Independent System Operator (“MISO”), the subsequent Briefing Orders for both proceedings, the Notice of Inquiry and most recently Opinion No. 569 in the MISO proceeding. We conclude that its recommendations improve both the reliability and predictability of base ROE results for all concerned parties under a variety of market circumstances.

Our proposed changes are comprehensive, addressing both the determination of the zone of reasonableness and the models used to estimate ROE. Key among our findings is the recommendation that the Commission expand the middle range of the composite zone for purposes of section 206 filings and give equal weight to four models—Discounted Cash Flow (“DCF”), Capital Asset Pricing Model (“CAPM”), Expected Earnings, and Bond Yield Plus Risk Premium (“Risk Premium”)—in establishing the zone and determining a new base ROE for proceedings under both sections 206 and 205 of the Federal Power Act.

“Our recommended changes to the ROE methodology embrace those elements that make economic and financial sense and recognize the need for both structure and flexibility,” said James Coyne, Senior Vice President at Concentric and co-author of the report. “Practical modifications to the models proposed to the Commission better reflect available investor information, and when taken together, will promote stability and predictability of results, create confidence in the resulting ROE determinations, and better connect the determination of the range of reasonableness to the base ROE.”

More from Concentric:

FERC’s Evolving ROE Methodology in a Period of Market Uncertainty

Factors Influencing Utility Cost of Capital in a Period of Market Turmoil

The report was authored by James Coyne, Joshua Nowak, and Julie Lieberman with analytical support from Peter Hoegler and administrative support from Jillian Barrile. All views expressed by the authors are solely the authors’ current views and do not reflect the views of Concentric Energy Advisors, Inc., its affiliates, subsidiaries, or related companies. The authors’ views are based upon information the author considers reliable. However, neither Concentric Energy Advisors, Inc., nor its affiliates, subsidiaries, and related companies warrant the information’s completeness or accuracy, and it should not be relied upon as such.
Factors Influencing Utility Cost of Capital in a Period of Market Turmoil

Published on April 14, 2020

By: John Trogonoski, Assistant Vice President

After trading at record highs in February 2020, stock markets around the globe have entered a period of extreme uncertainty and volatility as investors try to understand the potential economic and financial consequences of two external shocks:  1) a global pandemic (i.e., COVID-19); and 2) the resulting impacts on the worldwide economy. As a result, we have witnessed a sudden and sharp loss in stock market valuations and investor “flight-to-quality.”

While investors typically perceive utilities as a safe haven during periods of uncertainty, there has been a high degree of correlation between utility stocks and the broader market in the current market dislocation.  The table below shows the decline in equity prices for the broad market in the U.S. and Canada, and individual sectors within the utility industry.


Peak to Trough % Decline Mean % Decline as of 4/9/2020
S&P 500 Index -35.63% -17.95%
S&P Utilities Index -38.90% -14.44%
     Electric -29.37% -18.47%
     Natural Gas Distribution -25.41% -18.29%
     Water Distribution -16.32% -11.44%
TSX Index -37.42% -21.05%
     Canadian IOUs -31.96% -19.90%


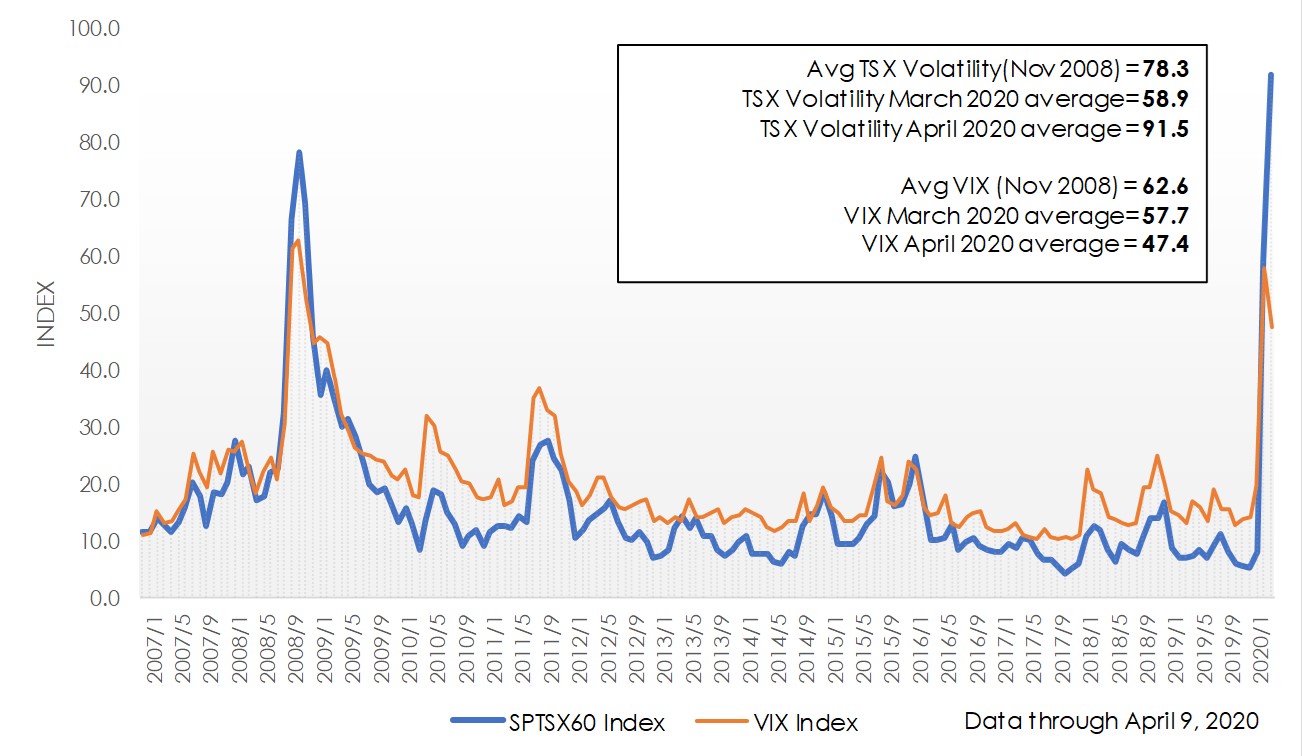
Even as government bond yields in the U.S. and Canada have fallen to near-record low levels, and central banks have reduced short-term interest rates and provided other monetary stimuli to support the global economy, the following factors suggest that risk has increased for equity investors:

Graph comparing VIX and TSX volatility

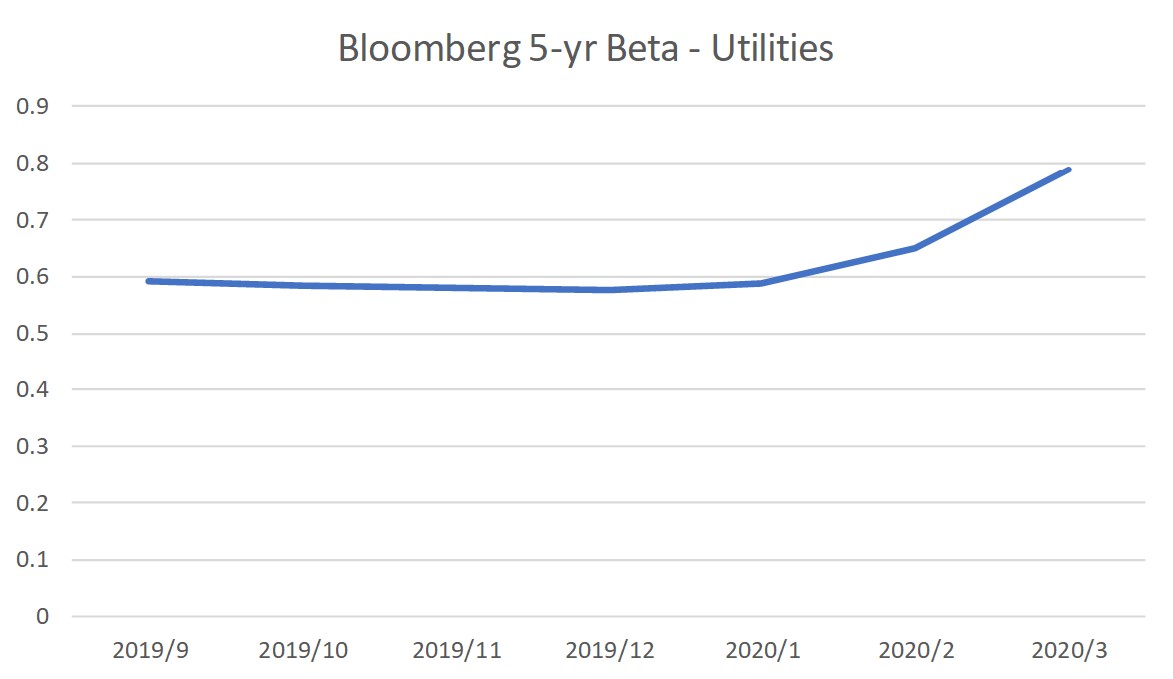
Graph showing 5-year beta calculated for utilities

These indicators suggest that investment risk has increased in the market for equities broadly, and also for utilities.  Equity and credit analysts have also expressed concern about other important issues such as rising uncollectible accounts, industrial load concentration, a potential moratorium on rate increases, and challenges to decoupling mechanisms. The ultimate impact of this period of elevated risk for utilities depends in large part to both investor reactions and the regulatory policy response to the economic downturn.  Maintaining healthy access to capital markets on favorable terms remains a broadly accepted standard of utility regulation, benefiting both customers and shareholders.  As was the case in the Great Recession of 2007-09, capital markets will once again be tested for the pricing of risk, and utilities are not escaping this scrutiny.

All views expressed by the authors are solely their current views and do not reflect the views of Concentric Energy Advisors, Inc., its affiliates, subsidiaries, or related companies.  The authors’ views are based upon information they consider reliable. However, neither Concentric Energy Advisors, Inc., nor its affiliates, subsidiaries, and related companies warrant the information’s completeness or accuracy, and it should not be relied upon as such.
Newsletter Sign Up
 
Search
 
Follow